Initial release: 22 May 2019
Over the past few years we have been active developing site-level flood risk analytics tools, e.g.
– Introducing Three New Tools for Investigating Flood-prone Areas (link, 11/2017)
– Advancing Flood Risk Analytics with Location Profile APIs (link, 09/2018)
Now we are pleased to release two additional new tools as part of our ongoing significant effort to improve the accuracy, transparency and accessibility of underling hazard risk information.
1. High-resolution Tiled Web Maps on Elevation Contours, Modelled Surface Water Flow Directions and Shaded Relief
1.1 From Raw Data to Tile Maps: Elevation data is the most important input to model flood risk. Flood maps, often presented in an abstract form, can be greatly enhanced with some measured contextual layers derived from elevation, such as contours, modelled surface water flow directions and shaded relief. Thanks to the Geoscience Australia’s Elevation Information System (ELVIS), ~75% of populated areas in Australia are now covered with LiDAR-derived DTMs. We adopt this popular open dataset to make high-resolution elevation-specific contextual layers.
The main challenge of the project was to efficiently scale up the production of high-resolution contextual layers from a small area to a national coverage (e.g. from a single map tile to tens of millions of map tiles). Initial thought was that the data size might be a major hurdle (e.g. the data size for a single region at high resolutions could easily exceed 100 GB, much larger than that of the national dataset at 30m-resolution), but it turns out pre-processing the ELVIS data to a clean format that the project needs is painstakingly slow. Some issues (e.g. edges and gaps) of the merged ELVIS data, 5m-resolution DTM mosaics directly downloaded from GA, are illustrated in this figure. We have undertaken five major revisions involving treatments (e.g. updates with 1m-resolution elevation if available at ELVIS, masking, and exclusion of questionable patches) for more than 150 scattered areas. If one deals with a small area, such issues may not be obvious.
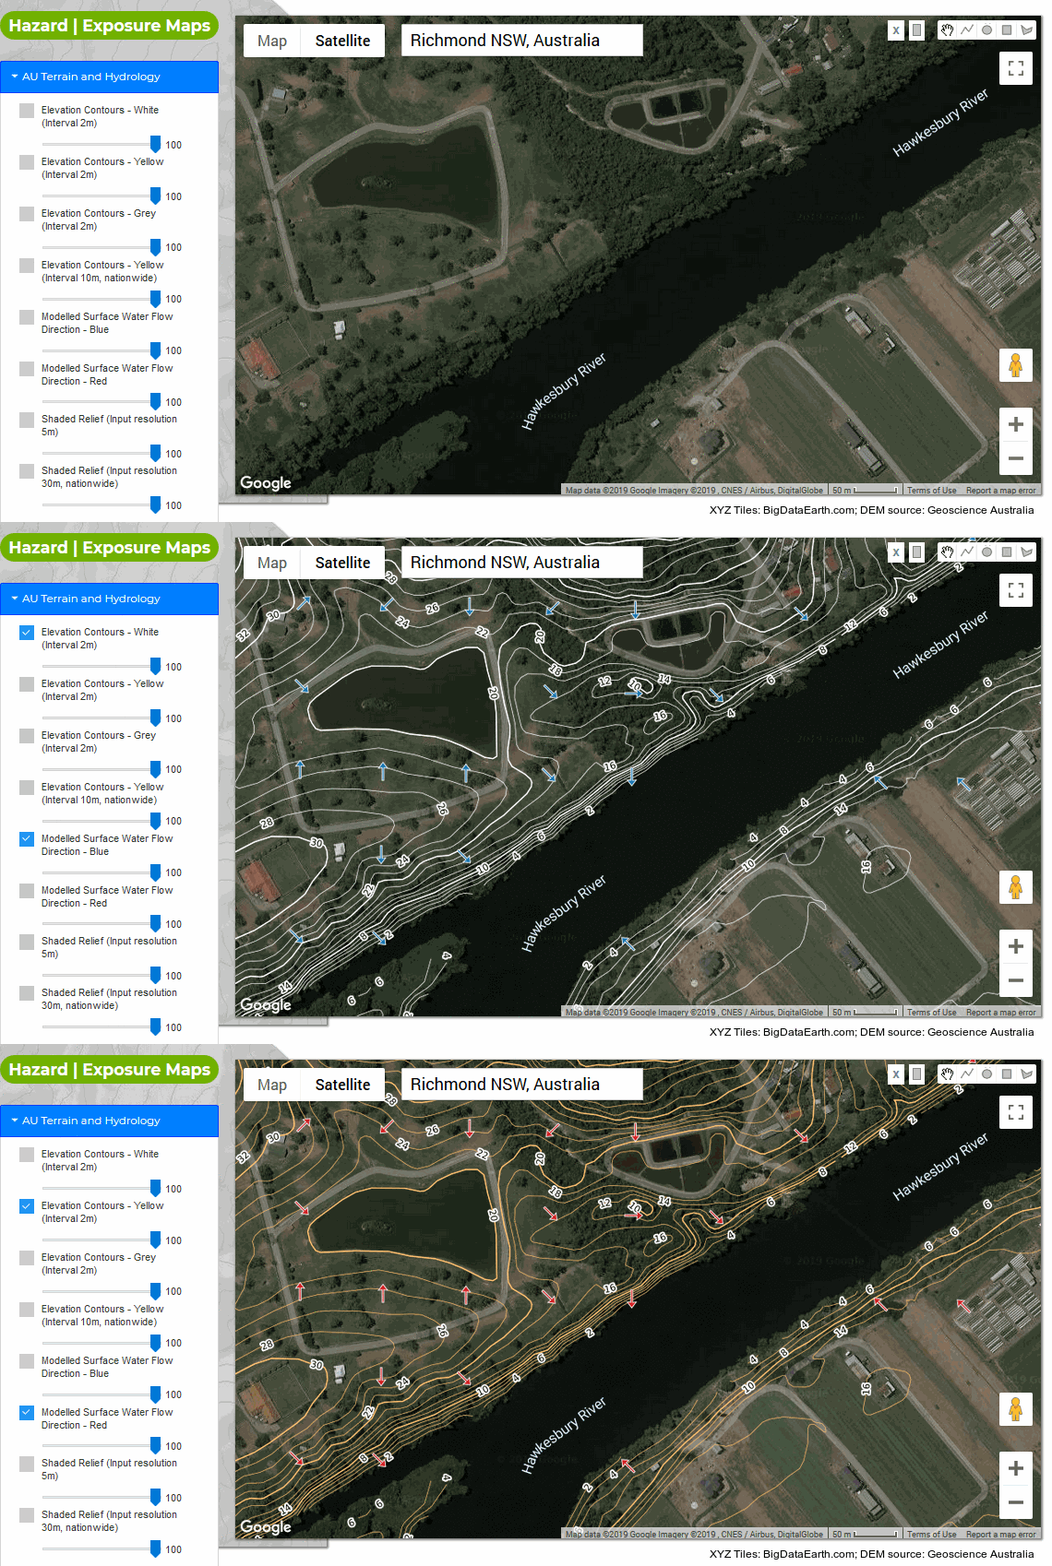
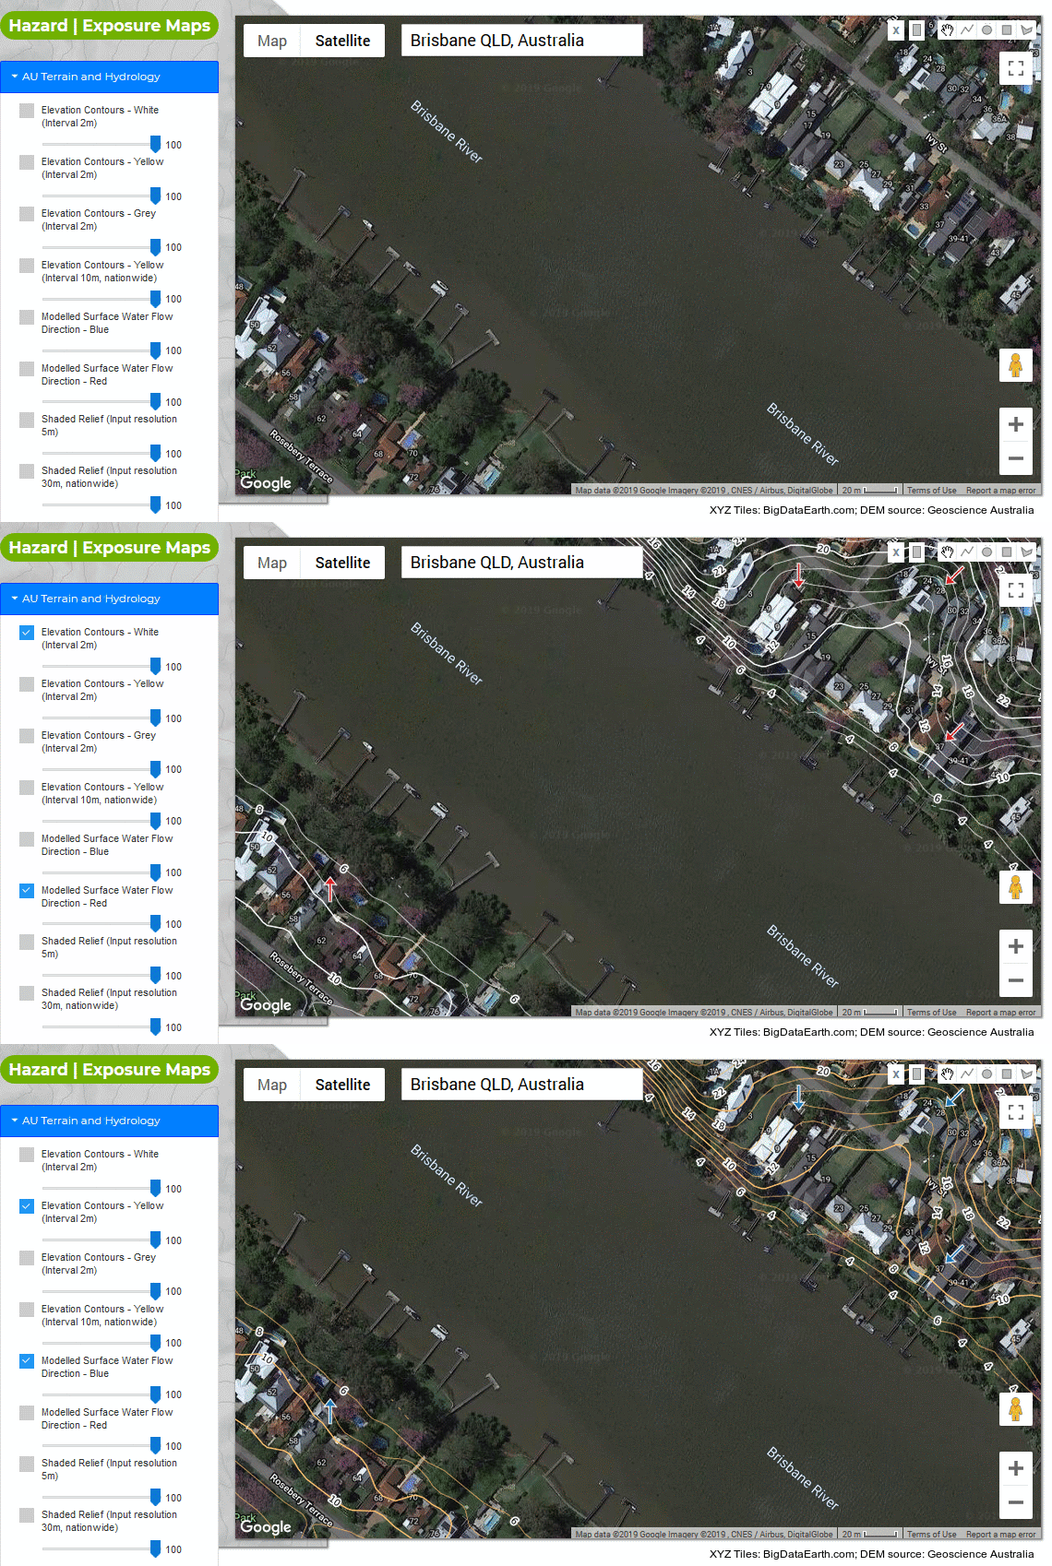
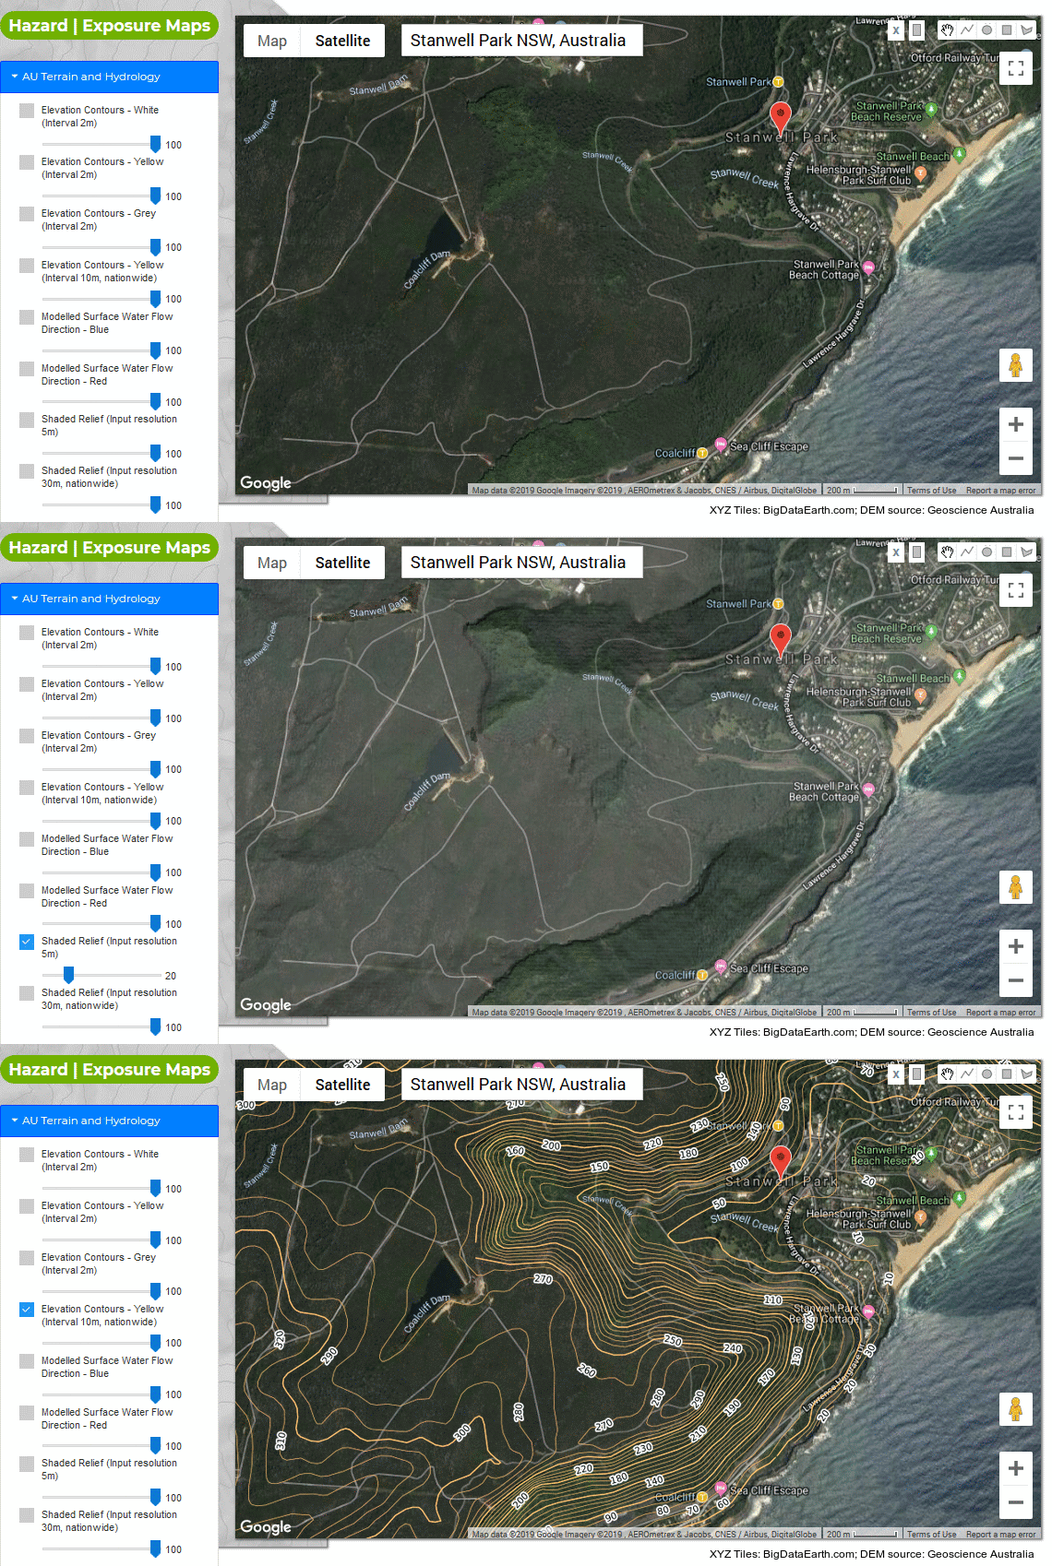
Figure 1 shows a list of newly developed tile maps (with XYZ Tiles convention). Figures 2, 3 and 4 are examples of the tile map on contours, flow directions and shaded relief, in an web app environment. As the original LiDAR data for the 5m-resolution DTM has a vertical accuracy of at least 0.3m (95% confidence), the choice of a contour interval of 2m may be conservative. Zoom levels shown in Figure 1 are those currently rendered as a minimum set and have been expanded constantly. For each tile map, we have explored various analysis and mapping techniques in order to present features both physically meaningful and cartographically clear.
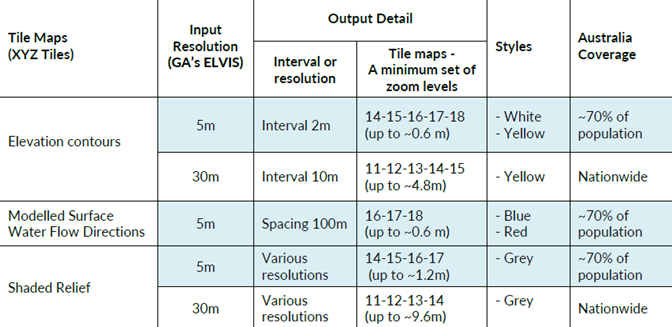
Figure 1: New tiled web maps on elevation contours, modelled surface water flow directions and shaded relief.
Figure 2: Example of the new tile map (Hawkesbury River, NSW; Zoom level 17 displayed)
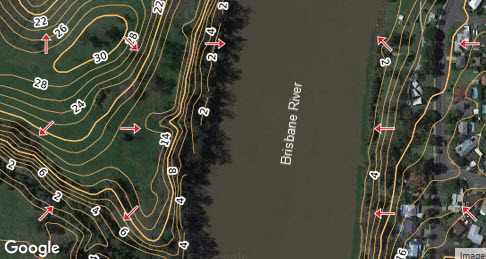
Figure 3: Example of the new tile map (Brisbane River, QLD; Zoom level 18 displayed)
Figure 4: Example of the new tile map (Stanwell Park, NSW; Zoom level 15 displayed)
More examples:
The following feedback is received from one of the reviewers of the new tile maps:
“I’ll never look at flood maps the same way again…”
1.2 Coverage: Detailed tile maps at zoom level 18 (resolution ~0.6m) were produced for the main populated region (highlighted in Figure 5), which accounts for ~70% of national population. For all capital cities, zoom levels for 2m-interval contours are up to 19 (corresponding to resolution ~0.3m) or even higher. For the baseline tile maps nationwide, a smoothed DEM (DEM-S ) from ELVIS, which had removed or reduced some caveats of the original 30m-resolution SRTM data, was used.
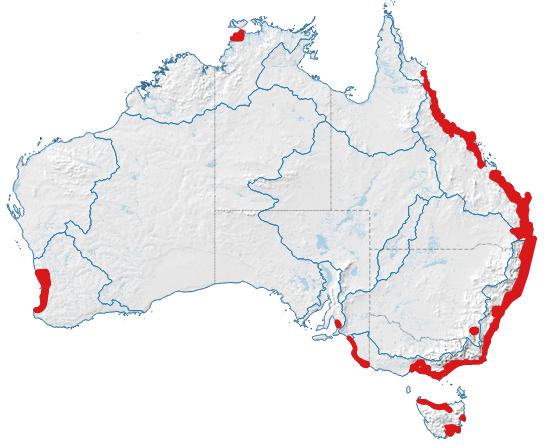
Figure 5: Highlighted region having detailed tile maps at zoom levels 18 (resolution ~0.6m), 19 (resolution ~0.3m, for capital cities) or even higher.
1.3 Access: All tile maps developed use the XYZ Tiles convention. URL for a map tile API request follows this format:
https://api.RiskMapping.com.au/tiles/v2/{z}/{x}/{y}.[png | jpg]?type=[1, 2, …] &apikey=[x]
Tile maps can be easily integrated with web or mobile mapping applications (those using Google Maps APIs – see Figures 2-4, Leaflet APIs, OpenLayers APIs, Mapbox APIs, etc.), by updating related URLs.
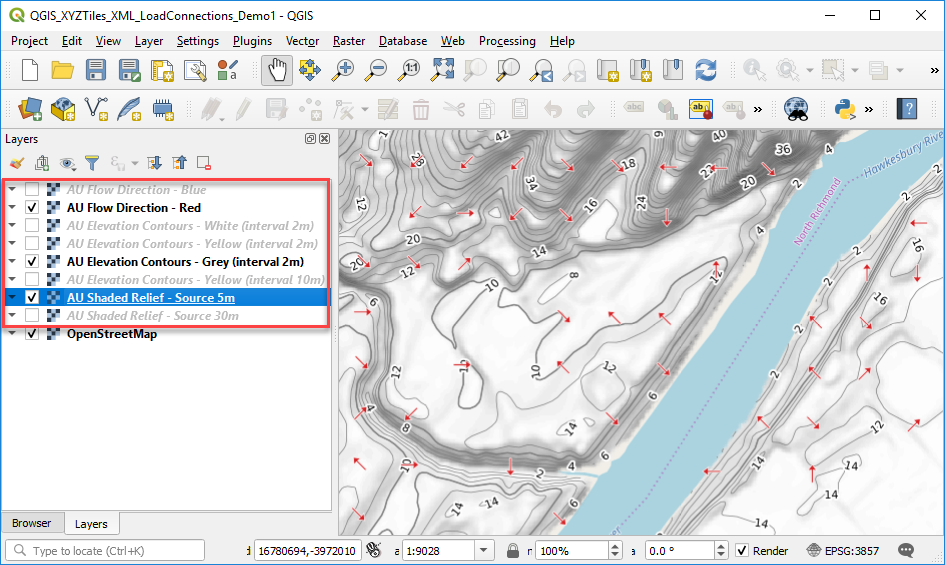
In desktop mapping software, it is straightforward, too. For example, in QGIS V3 or V2.18, a user just needs to pass on the URL to a “New Connection” after clicking “XYZ Tiles” button; a new tile map will be accessible serving as an additional GIS layer (demonstration). An XML file with grouped XYZ Tiles connections has been prepared so a user can load this file directly into QGIS to make all tile maps available (Figure 6).
We have designed a number of subscription plans for having access to the tile maps seamlessly. The usage is linked to the API key provided, and logging info related to the content delivery network (CDN) is also catalogued.
Figure 6: New tile maps loaded in QGIS (Zoom level 16 displayed)
2. Comparing Multiple Elevation Data Sources
As we all know, modelled flood risk and the contextual layers presented above are subject to the elevation data source used; vertical accuracy, spatial resolution, how the data has been acquired and processed, etc. are all important influencing factors. It is very common that one has access to multiple elevation sources when investigating flood-prone locations, and for this we first create a handy tool that allows the comparison of multiple elevation sources easily. With a single API call or a button click, elevation for a location (with latitude and longitude) will be queried and returned with respect to a list of elevation data sources:
-
5m-resolution DTM
-
30m-resolution DEM
-
Google Maps Elevation
-
… (user-specific additional elevation sources)
This offers a quick overview about the likely range of elevation variations from multiple data sources. This tool is delivered with a web API and can be integrated with web apps. At an advanced level, detailed site-level elevation reporting (e.g. 2D profile and 3D perspective) regarding each elevation source can be generated on the fly. Figure 7 shows such an example within a web app.
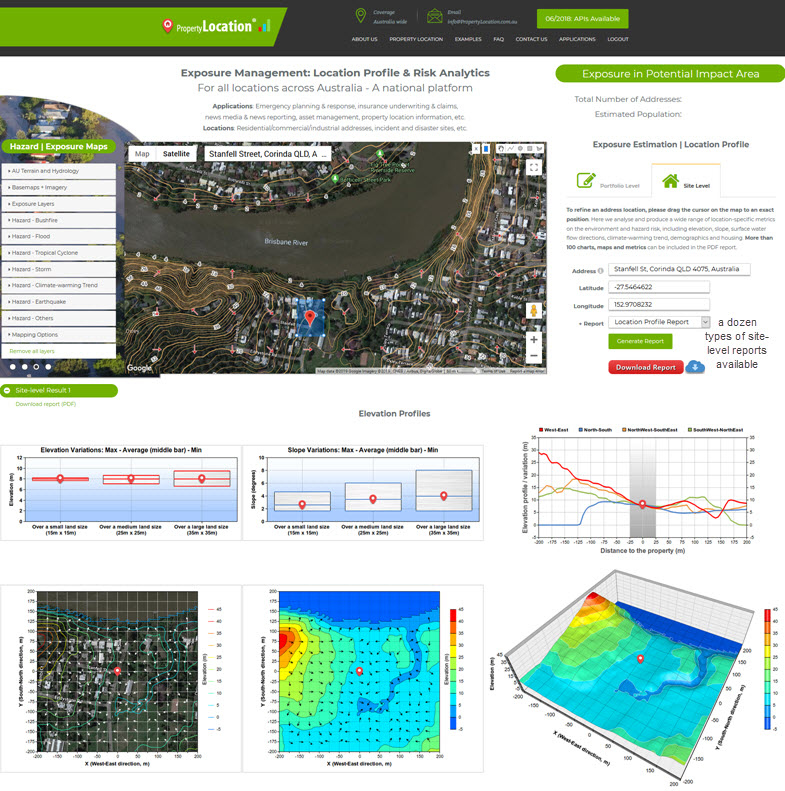
Figure 7: Detailed reporting for each elevation data source, in an exposure & risk analysis web app.
3. Summary and Further Thoughts
Detailed contextual layers and terrain metrics are critical to investigate flood risk in a tangible and less uncertain way. The new and unique tile maps developed can be an effective communication tool to aid emergency response and planning, insurance underwriting and claims, etc.
We plan to increase the coverage by analysing high-resolution ELVIS data for regional areas and apply the cloud-based processing workflow to client elevation datasets. Other contextual layers in relation to the hydrodynamic process can be added as well.
We believe the detailed tile maps here are complementary to many other basemaps (e.g. those from Google Maps and OSM). We will explore related potential opportunities in the future.
In retrospect, two enabling factors – open geospatial data from government agencies and cloud computing infrastructure from major vendors (i.e. data and technologies) – have made this large-scale project possible. The creation and delivery of new tile maps via geospatial web services is another milestone in our journey to advance location-centric business applications with cloud computing.


