2 October 2018
Bushfire (wildfire or forest fire) risk assessment has been a very common topic in research and practice. Many risk analysis projects, such as identifying likely causes of fire occurrences, mapping fire-prone areas and assessing Bushfire Attack Level (BAL) for buildings, are in place to assist the whole process of bushfire risk & emergency management – from prevention to preparedness to response to recovery.
As a new effort to advance bushfire risk analytics and its rapid implementation, we have recently developed four types of information products and related Location Profile APIs, including:
- au-location-analytics (API reference)
- au-bushfire-analytics (API reference)
- au-exposure-analytics (API reference)
- us-location-analytics (API reference)
- us-vegetation-analytics (API reference)
For a fire-prone location in Australia (and in the State of California), API-enabled, site-level location profile report can be produced for innovative fire risk analytics. Independent developers looking for property location and hazard risk information can integrate the accessible APIs in third-party applications, so the information and insights revealed be readily shared with the general public and decision makers. For example, these web pages (e.g. Link 1 and Link 2 with Google Maps embedded) are created to allow users to request analytical reports automatically. The Developer Portal provides instructions on how to implement APIs at scale.
This blog showcases the APIs and information products that are available for site-level bushfire risk analytics.
1. Location Profile Report for Fire-prone Addresses
Location profile report for a fire-prone address can be automatically generated and delivered with related APIs. Here we show such reports which were once prepared in response to two recent major fires in Australia and in the US, respectively. Note that for Australian reports, detailed exposure estimates are also included.
1 – Integrated exposure location profile report (~30 pages, PDF)
Containing metrics on the environment and exposure estimation – terrain, bushland, exposure, population, housing, etc. Full report download: https://t.co/MJkvSYL1Bl#Tathra #bushfire @NSWRFS @ABCemergency @abcnews pic.twitter.com/DzeMcCQnJx— BigData Earth (@BigDataEarth) March 19, 2018
#HolyFire observed by the latest #Sentinel2 imagery on 12 August 2018
1. Big picture – Burn scar changes 4 days apart, from 2018-08-08 to 2018-08-12
2. Detailed view – API-enabled address-level property location profile reporthttps://t.co/s9Np7n88wz@CopernicusEU @NASA_Landsat pic.twitter.com/0Y3zEpSFz6— BigData Earth (@BigDataEarth) August 13, 2018
2. Estimating Exposure At Risk
Quantifying exposure at risk is a generic and useful task in risk analytics. Dedicated APIs have been developed and more information on these can be found in this article “New Methods and Tools (Web APIs) for Innovative Exposure Analytics“. Results on exposure estimation can be reported as a standalone PDF report, or integrated into the main location profile report.
Rapid response to the major bushfires in Sydney’s south-west raging on the weekend (14-15 April 2018):
Property location profile report, including exposure estimate
Location: Brushwood Dr, Alfords Point NSW 2234
Full PDF report: 31 pageshttps://t.co/U24NGSnco7#NSWRFS #bushfires pic.twitter.com/x07W2AK5MN— BigData Earth (@BigDataEarth) April 15, 2018
3. Visualising Fire-prone Areas
Bushfire property damage is generally confined to the bushland-urban interface, therefore to broadly simulate bushfire penetration into urban areas is always handy and insightful. Last year we released a project titled “Visualising Potential Bushfire Risk for Addresses in Australia: A New Cloud-based Approach“, where we focused on visualising bushfire risk in terms of the distance between bushland and exposure locations.
Related APIs have been developed and API output is usually shown in GIF animation. A multi-page PDF file (each page showing potential impact areas at a given distance range) can also be generated.
2 – Bushfire prone areas animation. Bushland is classified from the 11 March 2018 Sentinel-2 satellite imagery (soon before the fire).
Animation download: https://t.co/DLbCBjsMs7#Tathra #bushfire @NSWRFS @ABCemergency @abcnews pic.twitter.com/3zN7qj3EH2— BigData Earth (@BigDataEarth) March 19, 2018
4. Identifying Mountain Ridges Directly Facing Prevailing Winds and Calculating Terrain Wind Effect
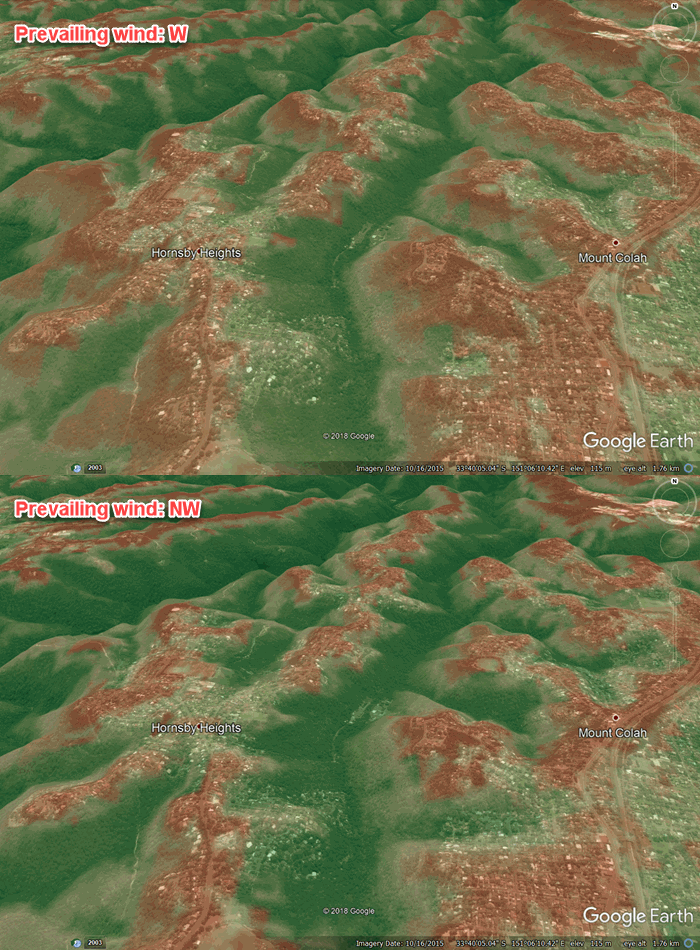
It’s well known that a fire will burn faster uphill (e.g. doubling fire speed for every 10-degree increase in slope) and fast-moving fires uphill become high intensity very rapidly. Mountain ridges that directly face prevailing winds are usually regarded most dangerous during bushfires, since the area is easily prone to radiant heat, flame contact and ember attack, three key mechanisms in bushfire propagation. To identify those mountain ridges involves the calculation of dynamic interactions among prevailing winds, terrain aspect and slope. On top of that, by superimposing layers on vegetation and exposure distribution, we are able to classify mountain ridges that have dense exposure most at risk. Three prevailing wind directions (SW, W and NW, more specific to the fire weather in southeastern Australia) are prescribed at this stage, and related APIs will return potential wind effect for each location. (Customisation for any wind direction can be made with respect to specific regions.)
We should note that the above approach is different from the conventional site-level assessment of Bushfire Attack Level (BAL). BAL assessment only considers a number of static factors (i.e. regional Fire Danger Index, slope and aspect of land, vegetation types, and distance between vegetation and the building of interest), and excludes the important factor on prevailing winds.
The result (as shown in the following animation) can be used for two purposes: bushfire emergency planning at the broad level, and differentiating potential bushfire risk at the site level. Risk ratings are produced for each direction of the prevailing winds considered.

