18 June 2018
Almost every industry has some types of exposure data, and its data quality and analysis are crucial for overall exposure management and decision making. For the businesses dealing with environmental, industrial, technological and man-made hazards and risk, the spatial and temporal accuracy of the underlying exposure data is among the most important. There is a constant demand for up-to-date exposure data at finer spatial resolutions and new analytics. This blog is not on exposure data per se but introduces some new methods and tools for rapid automated exposure analytics, which might be useful for your existing exposure management system.
1. Methods
Exposure analytics is a very generic task. One can perform exploratory exposure estimation with what-if scenarios before a hazardous event, or in impact assessment after the event. Common approaches for defining at-risk areas in exposure analytics include:
-
Hazard footprint areas (e.g. wind intensity zones of tropical cyclones and earthquake ground shaking zones)
-
Geospatial distance buffers (specific to ground features in point, line or polygon shapes)
-
Manual drawing (e.g. typically in polygon shapes)
Each has wide applications. Exposure analytics may be examined from the following four perspectives:
-
Hazard footprints
-
Exposure types (e.g. residential, commercial and industrial; building, contents and business interruption sum insured)
-
Spatial
-
Temporal (i.e. the dynamic nature of exposure data)
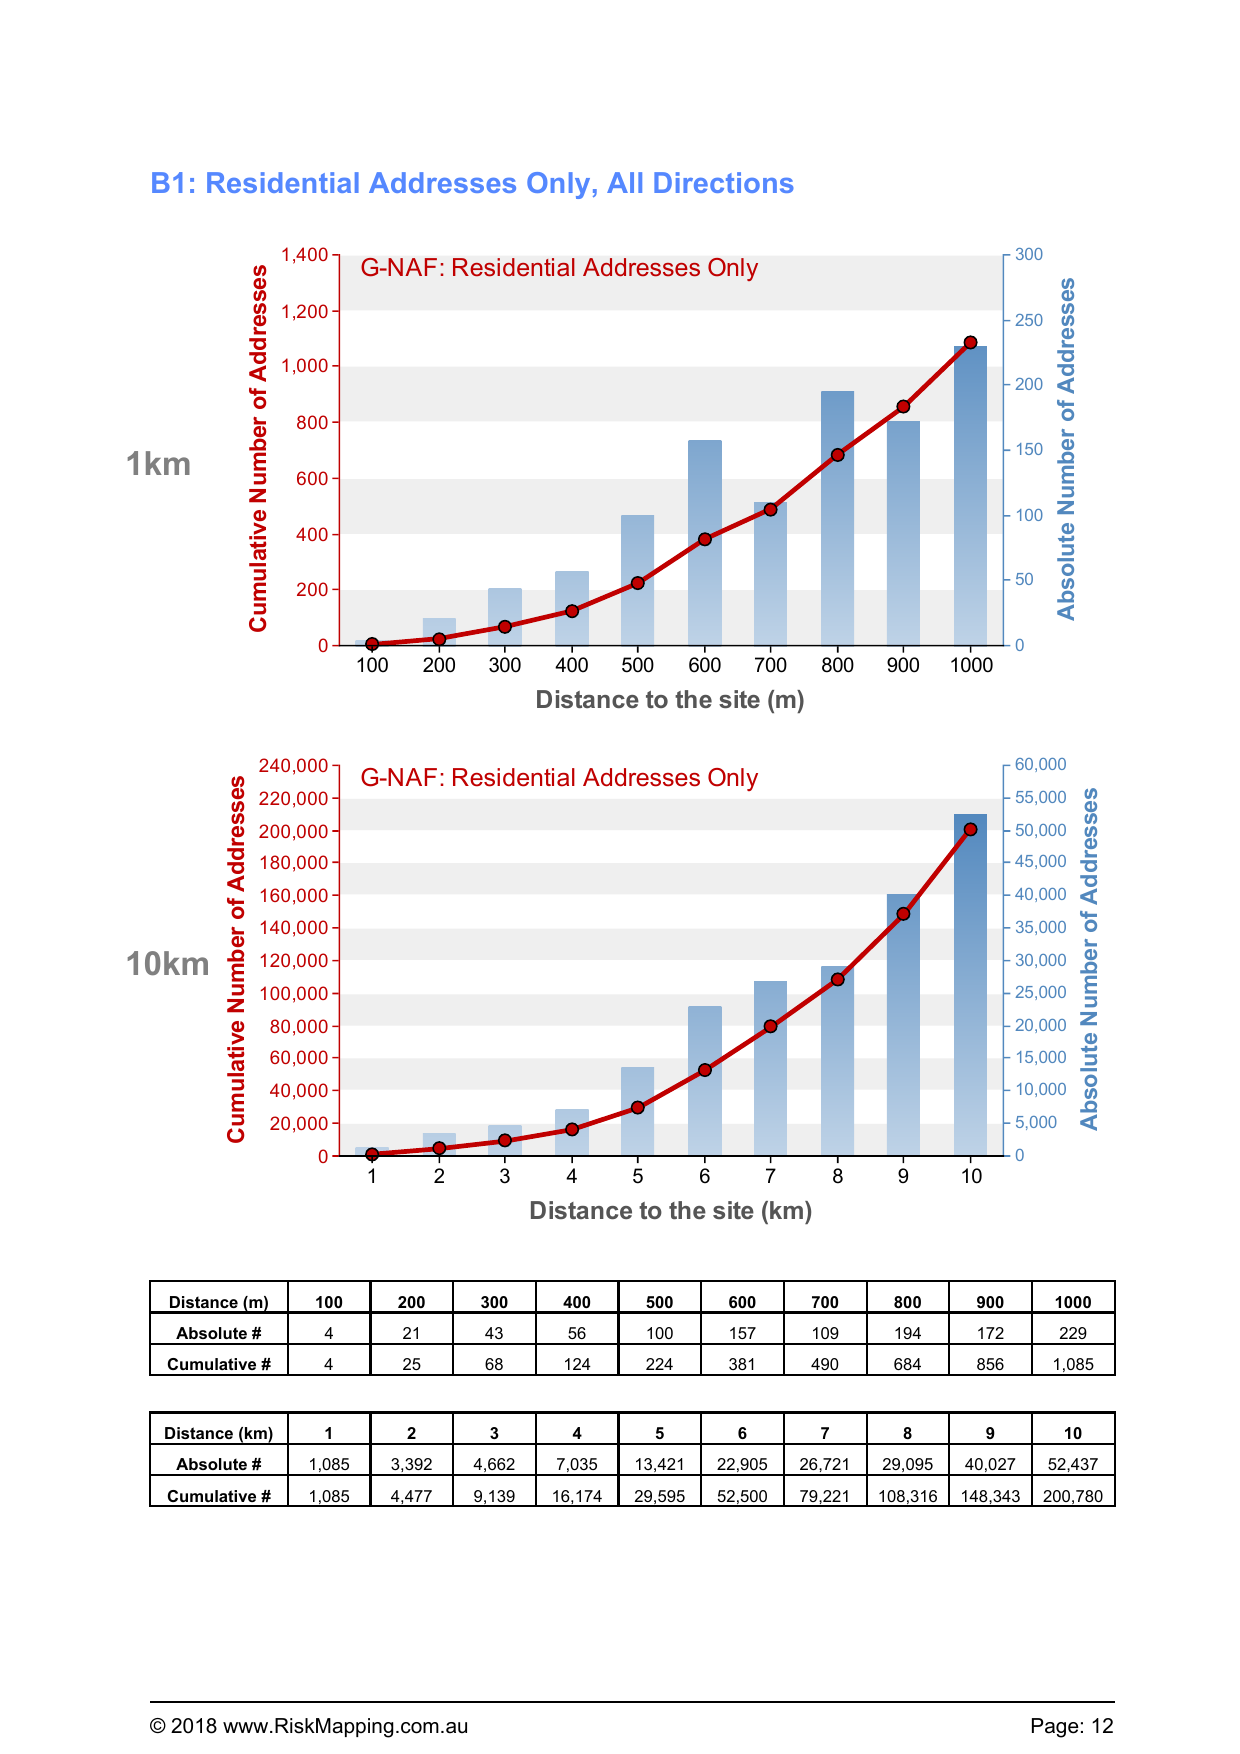
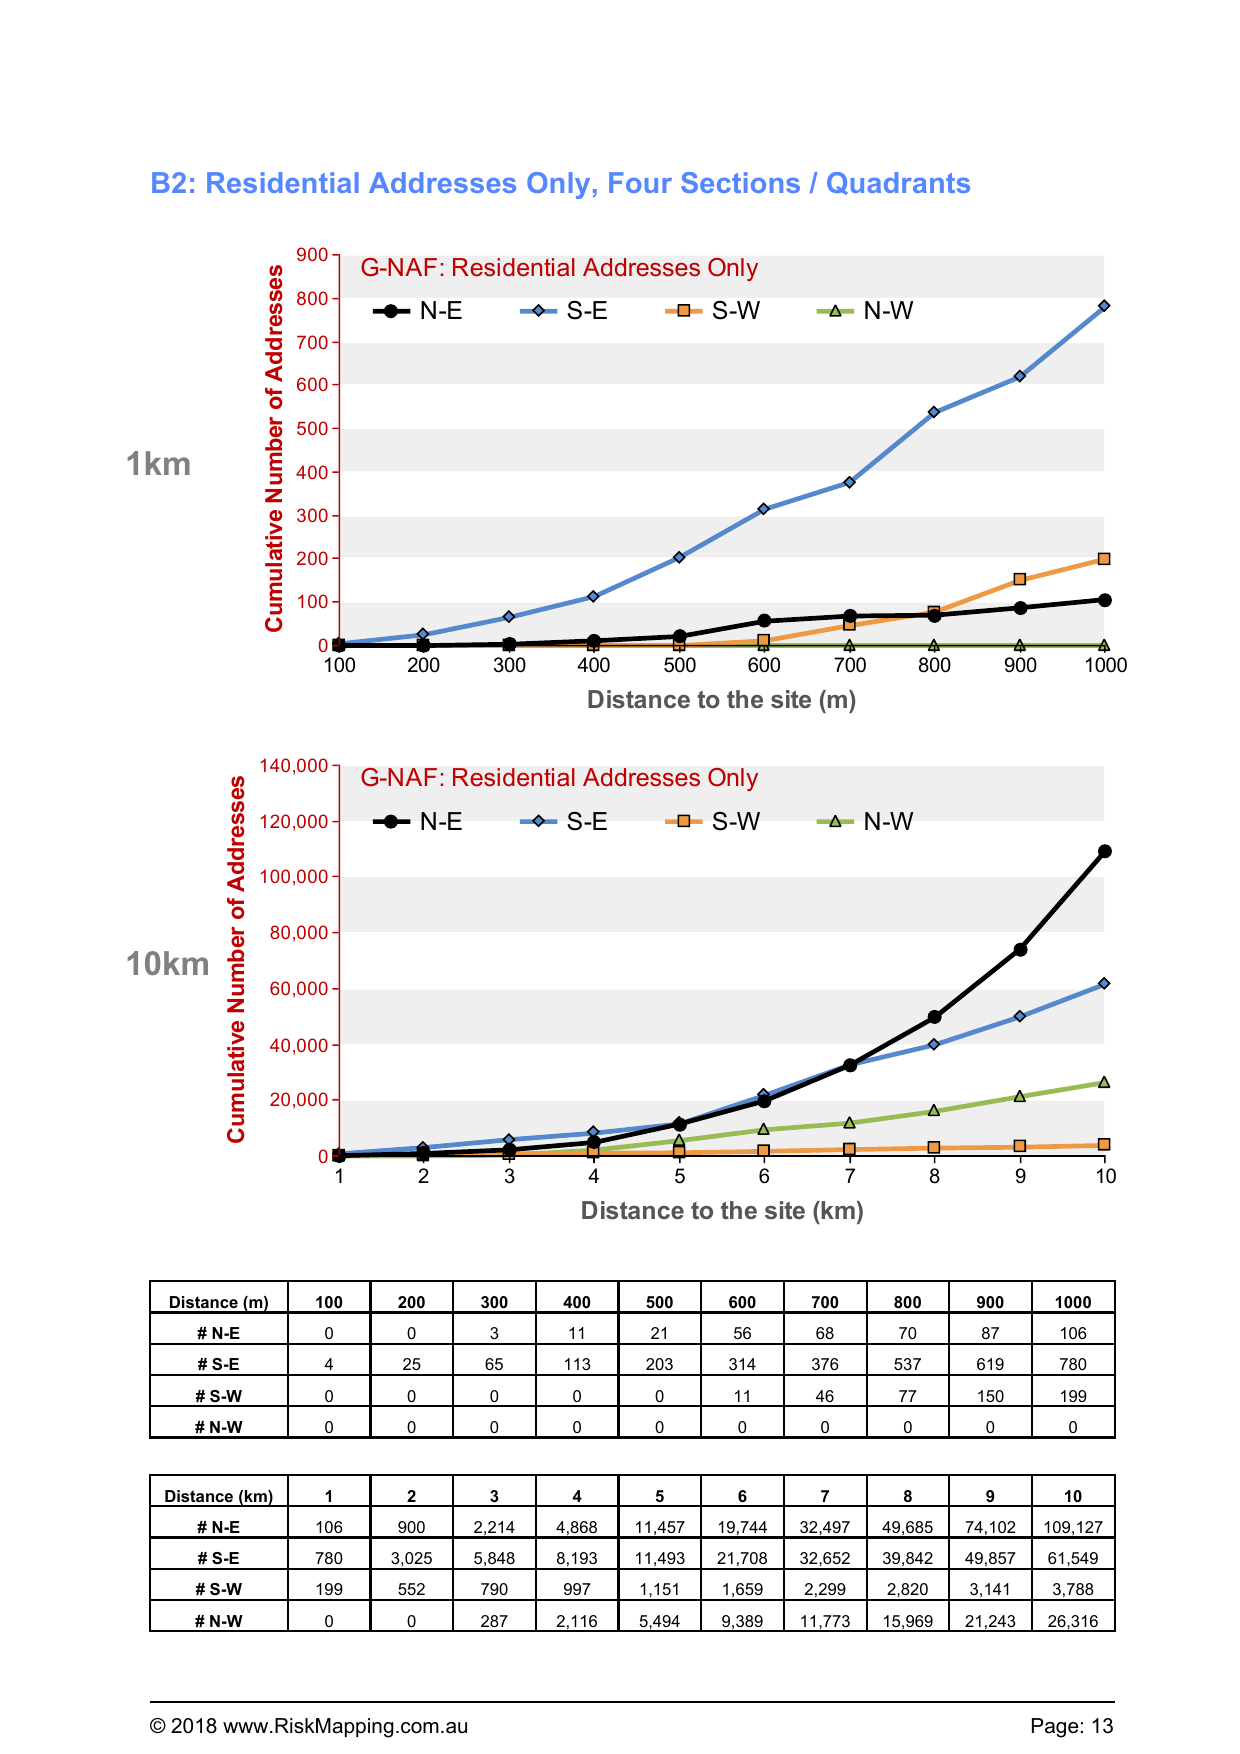
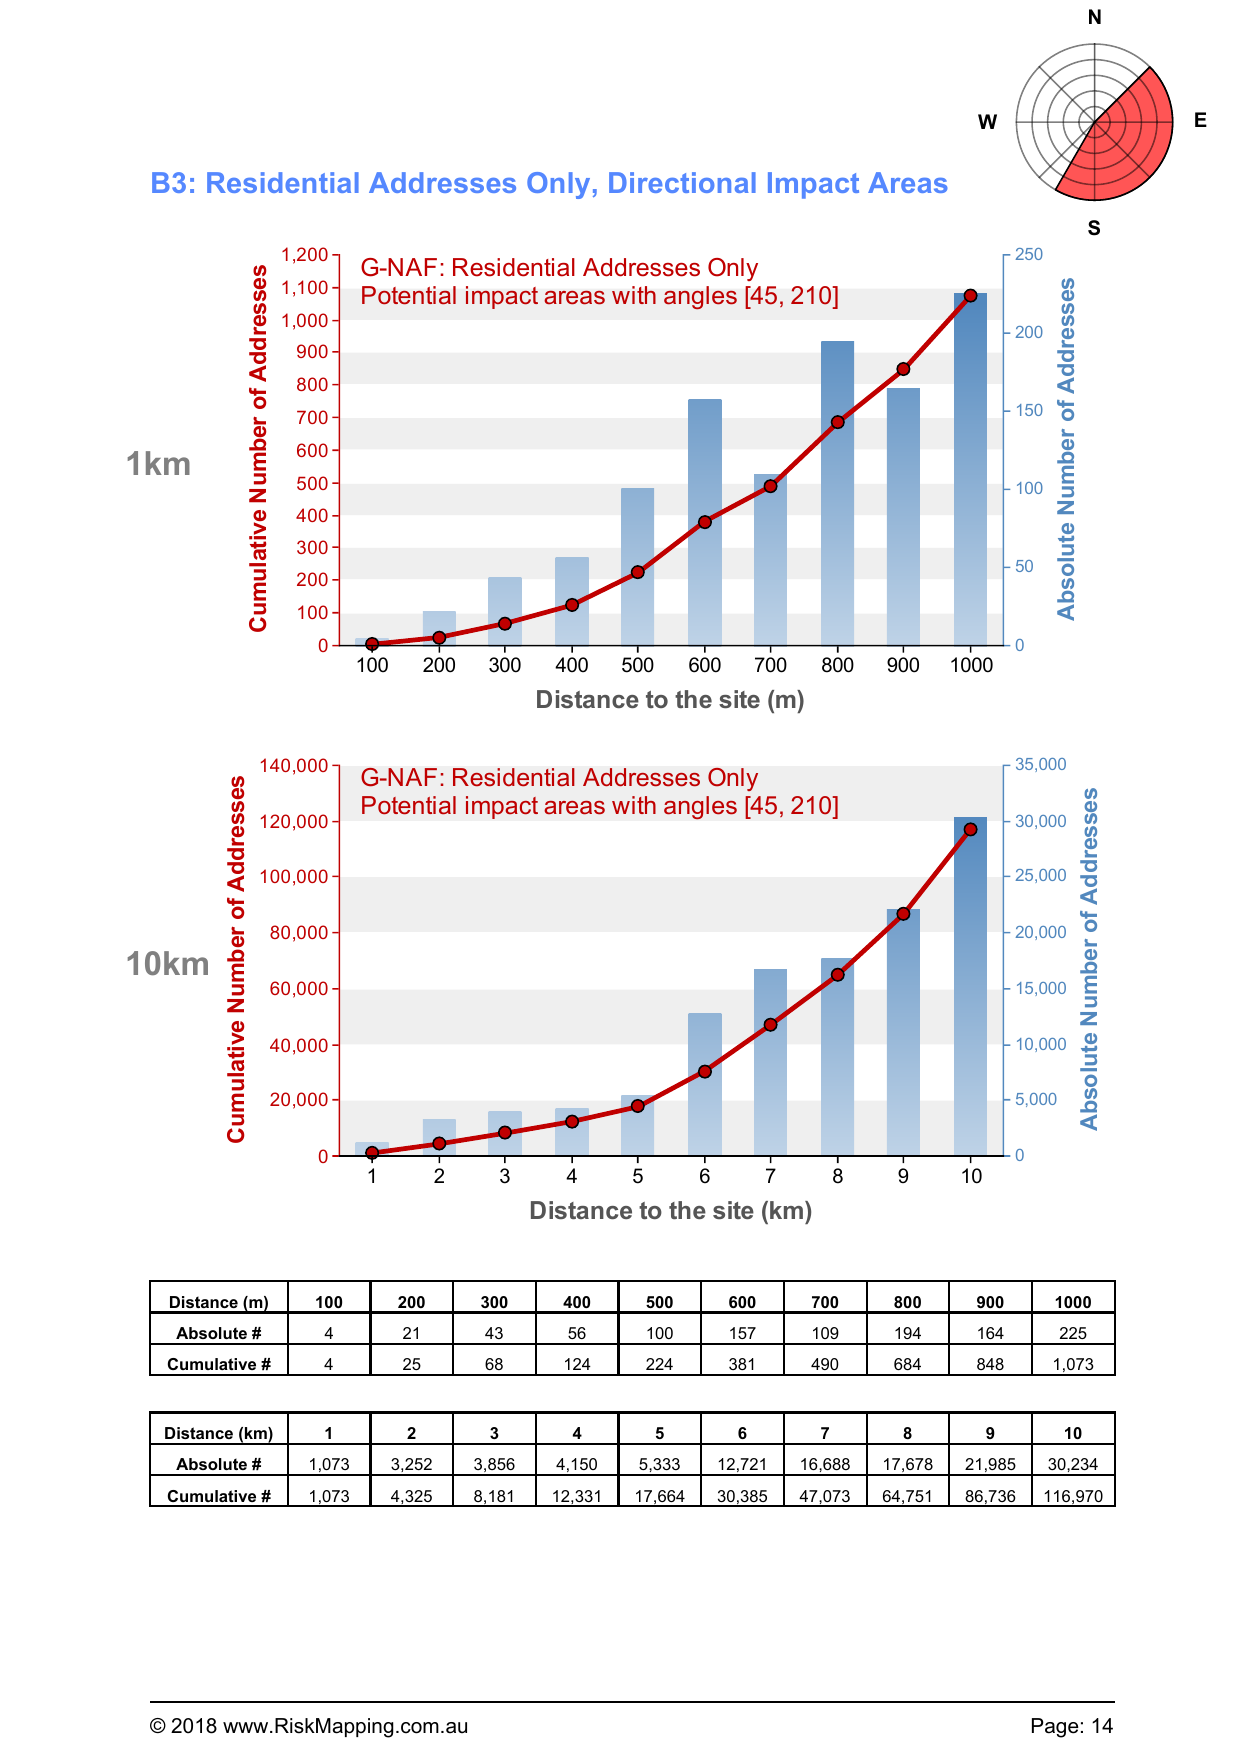
We have designed a dozen methods to more thoroughly analyse exposure data and more readily reveal insights. Maps, charts, animations and other effective visualisation tools are being adopted. Here we illustrate some new methods for exposure analytics in relation to a few recent major events in Australia and overseas (Figure 1; full report with exposure estimates available by clicking each event link below):
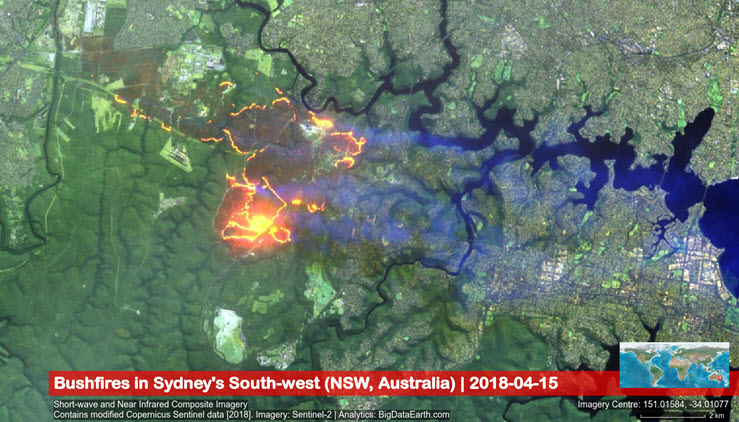
Figure 1: Demonstration of new methods for exposure analytics
2. Tools (Web APIs)
Location-based exposure analytics are commonly performed with GIS. We implement exposure analytics in an automated manner via web APIs, which are embedded in our cloud-based geospatial big data and analytics platforms.
A simple API call can quickly return a location profile report with full exposure estimates being examined from a range of perspectives. We have developed two APIs for exposure analytics – one specific to Australian address counts and the other specific to worldwide population distributions:
https://api.bigdataearth.com/au/exposure-analytics/{query parameters} – API reference
https://api.bigdataearth.com/ww/exposure-analytics/{query parameters} – API reference
Currently, for Australian exposure analysis, the February 2018 open Geocoded National Address File (PSMA, Australian government) is used; for global exposure analysis, the Global Human Settlement (GHS) population grids (European Commission, Joint Research Centre) used.
3. Discussion
If exposure data is in another form, e.g. building stocks, infrastructure assets or sum insured from government agencies and the insurance industry, similar analysis and reporting can be carried out efficiently.
There are three main ways of hosting exposure data for related analytics. If the exposure data is on a client’s server, we offer customised add-on software for exposure analysis. If the exposure data is hosted by our servers (on Google Cloud Platform), we deliver analytics via dedicated APIs unique to client’s data and uses. The third way is to host exposure data and perform analytics on third-party secure data exchange platforms.
For any application platform or system, there is a limit to self-produce everything. That is partly why web APIs hold promise, and domain-specific datasets and analytics can be independently provided by third-party APIs. This blog illustrates exposure quantification via APIs. For the case of risk analysis and loss modelling, every component of the risk equation – hazard, exposure, vulnerability and loss estimation – can be developed and delivered via web APIs. The modular and flexible nature of APIs for data, modelling and reporting represents a paradigm shift in application development.
Related:
– Releasing a New Web Mapping, Analysis and Reporting App on Exposure Management (Link)
– New R&D in Property Location and Hazard Risk Analytics: A Transformative Journey from Desktop Computing to Cloud Computing (Link)


