It has been well observed, modelled and reported that bushfire risk is on the rise under a rapidly warming climate. Earth observation, remote sensing and image analysis are among the most important technologies to manage bushfires nowadays – from disaster prevention to preparedness, from hotspots detection to movement monitoring, from response to recovery, from damage assessment to community resilience.
We have long been interested in bushfire research. For example, we reported the catastrophic 2019/2020 Australian bushfires (the ‘Black Summer’ bushfires) using various satellite images, and timely analysis results were shared on social media, including Twitter (e.g. link 1, link 2) and LinkedIn (e.g. link 1, link 2 and link 3).
Other events:
– The March 2018 Bushfire in Tathra, NSW, Australia link
– The April 2018 Bushfire in Sydney’s South-west, NSW, Australia link
New development at the bushland-urban interface is a significant issue that contributes to the growing bushfire risk. Dynamic land cover changes at the interface need to be constantly monitored and measured. On this, image-based analysis provides a cost-effective solution.
We routinely use medium-resolution satellite imagery (e.g. Sentinel-2 and Landsat-8) and high-resolution satellite, aerial and drone imagery, together with statistical machine learning and new artificial intelligence methods (e.g. deep convolutional neural networks), to create or update land cover data layers, such as vegetation (tees and grass), surface water and buildings. Here we showcase some of our recent R&D activities using examples specific to bushfire-prone locations in NSW, Australia.
1. Mapping Bushland using New Imagery
Figure 1 shows classified bushland based on 10m-resolution Sentinel-2 imagery acquired in April 2020. Efficient image processing workflows have been developed to produce such thematic data quite accurately for very large regions (e.g. at a state and territory level).
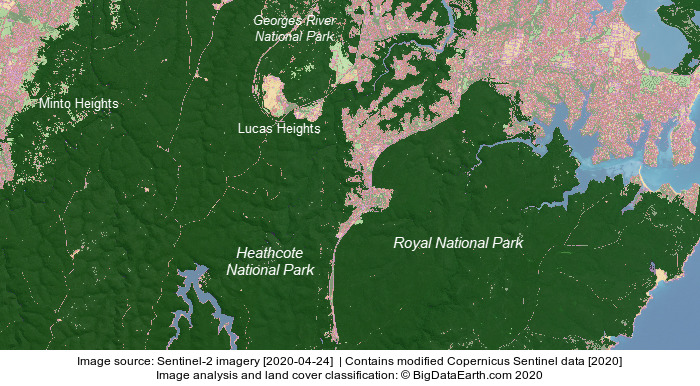
Figure 1: Classified bushland based on recent Sentinel-2 imagery. Location: South and Southwest Sydney, NSW.
2. Mapping Buildings and New Developments at the Bushland-Urban Interface
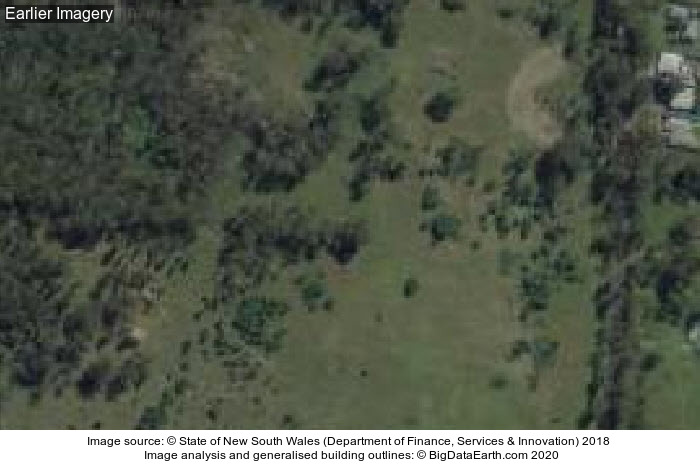
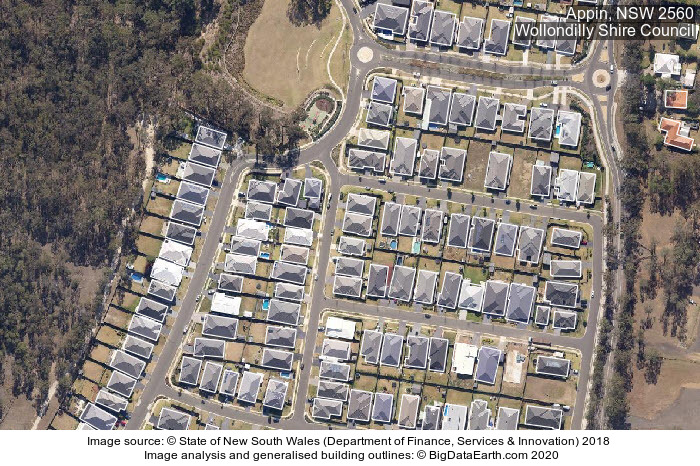
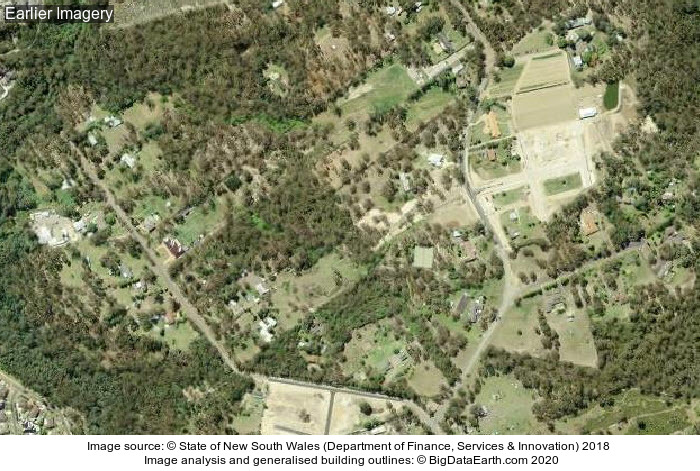
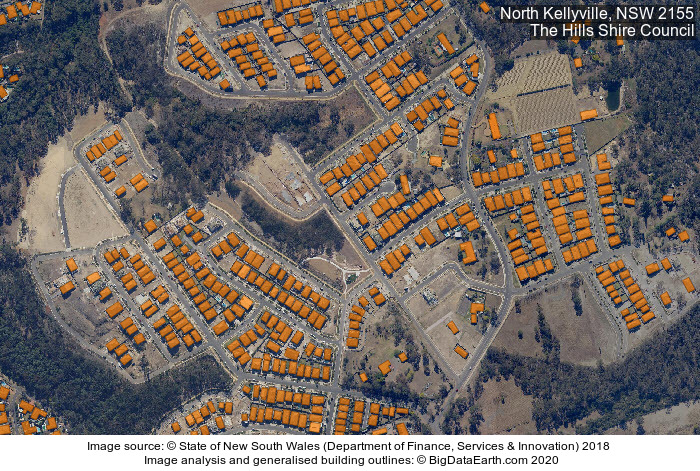
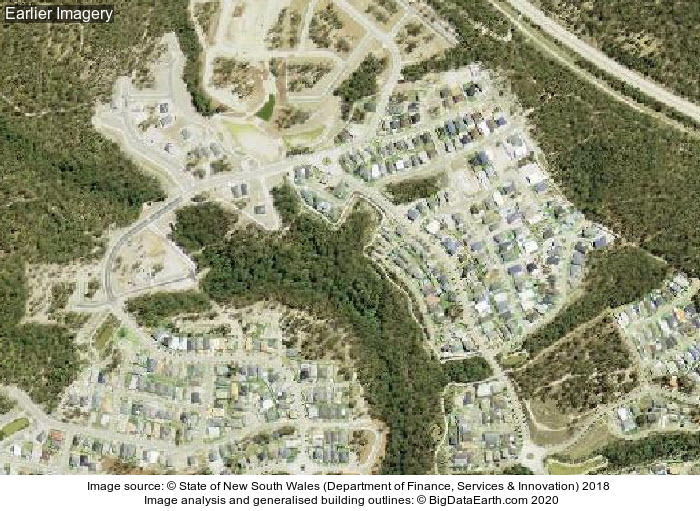
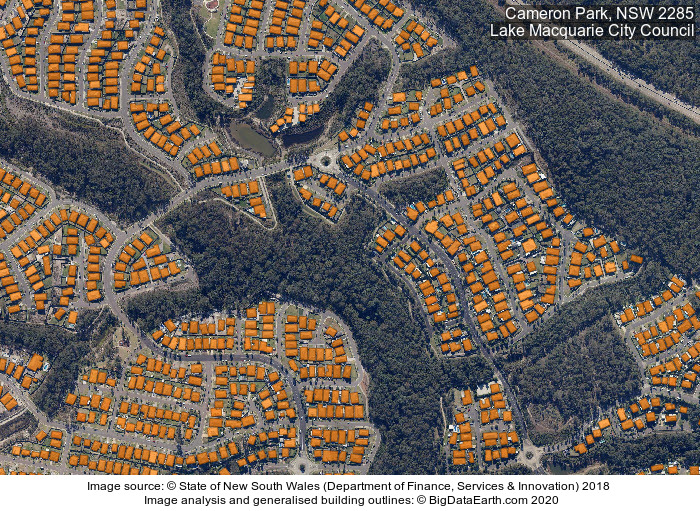
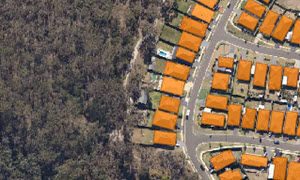
With deep learning neural networks, generalised or approximate building footprints can be extracted from high-resolution imagery more reliably (e.g. link). Figures 2-4 show three suburbs in NSW at the bushland-urban interface where new housing has been developed over the past few years. By performing such time series image analysis, we are able to quantify bushfire-prone exposures and their changes over time more accurately. This work takes advantage of regularly updated high-resolution images provided by the state government.
Figure 2: Locating new buildings at the bushland-urban interface. Location: Appin, Wollondilly Shire Council.
Figure 3: Locating new buildings at the bushland-urban interface. Location: North Kellyville, The Hills Shire Council.
Figure 4: Locating new buildings at the bushland-urban interface. Location: Cameron Park, Lake Macquarie City Council.

