8 December 2017
For flood hazard modelling and risk analysis, Digital Elevation Model (DEM) is indispensable. Probably the most important metric about DEM quality is its vertical accuracy. Unfortunately, it is often confusing in literature and among various data offerings, and there are serious implications for applications, e.g. whether flood hazard rating can be confidently quantified at an individual site level or has to be aggregated.
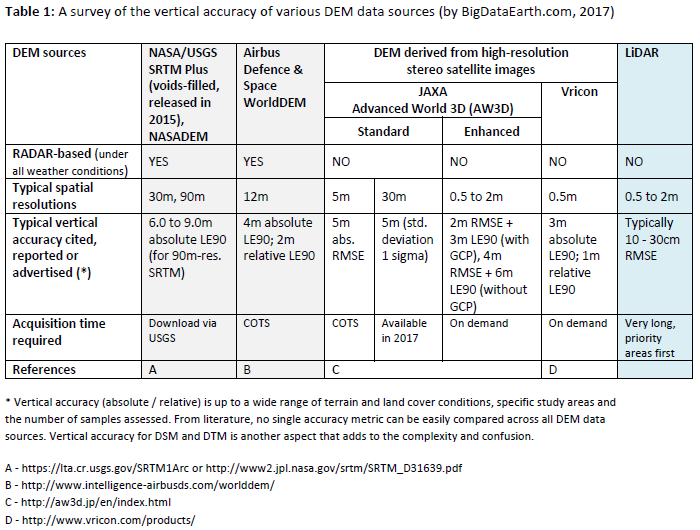
Table 1 shows a survey of DEM vertical accuracy. Reported vertical accuracy is up to a wide range of terrain and land cover conditions, specific study areas and the number of samples assessed. From literature, no single accuracy metric can be easily compared across all DEM data sources; instead, detailed descriptions about potential errors are often incomplete or missing. We try to seek its clarification from the following six perspectives, and hope some users will find the information refreshing and useful.

1. DEM vertical accuracy is related to DEM horizontal resolution
When evaluating the DEM vertical accuracy, underlying spatial units (in this case, pixels in raster/grid at different sizes say 5m by 5m or 10m by 10m) should be chosen first. Unlike spot elevation (over a single spot), the value for each DEM pixel actually is average elevation over the whole spatial unit chosen. It is easy to understand that at coarse resolutions, this single elevation value is overly generalised. For a flat area this effect is minimal, whereas for a hilly area this can be very inaccurate.
2. DEM vertical accuracy can be confusing easily
This is because DEM vertical accuracy depends considerably on site-specific terrain and surface characteristics, such as topographic conditions (e.g. flat, sloping or rugged) and land covers (e.g. buildings or vegetation). It is important to address these caveats when reporting DEM vertical accuracy and starting to use a particular DEM dataset.
3. Vertical accuracy for DSM and DTM would vary
Digital Terrain Model (DTM) is usually derived by removing ground features (houses, trees, etc.) represented in Digital Surface Model (DSM). Both are generally called DEM. If features on the ground surface are complex (the case of populated and settled areas), associated uncertainties of digitally removing those features would be large. Therefore, the vertical accuracy of DTM is typically lower than that of DSM, especially for the DTM originally extracted from stereo images.
4. There are differences between absolute vertical accuracy and relative vertical accuracy
Relative vertical accuracy only considers internal relative elevation variations without looking at absolute global geo-references, so is typically better than the DEM absolute vertical accuracy.
5. There are many terminologies and metrics on vertical accuracy
Common metrics assessing DEM vertical accuracy include Absolute Mean Difference, and Root Mean Square Error (RMSE) and Linear Error (LE) expressed at various confidence levels (e.g. 90% or 95%).
There is a relationship between “vertical accuracy” (widely used in vocal exchanges) and “RMSE” (widely used in academic papers/reports) (reference):
“Most DEM users have what they consider to be a clear concept of the meaning of vertical accuracy, or accuracy of ±1-foot, for example, but such terms mean different things to different people. Few users realize that a Vertical Root Mean Square Error (RMSEz) of 1-foot nearly equates to Vertical Accuracy (Accuracyz) of 2 feet at the 95% confidence level.”
Such clarification is often missing. If a company proposes 1m RMSE for its DEM, that would mean a vertical accuracy of ~2m at the 95% confidence level.
6. Vertical accuracy of LiDAR-derived DEM
Vertical accuracy better than +/-30cm can be achieved with confidence using LiDAR these days. But it does not mean and far from true that all LiDAR-derived DEMs have this high level of accuracy!
For small areas or certain flat regions, the vertical accuracy of LiDAR-derived DEM might reach an exceptionally high level if the LiDAR point cloud is dense enough. The accuracy of LiDAR-derived DEM can be affected by many factors, including particular LiDAR systems, LiDAR capture specifications and very critical post-processing steps; each could vary a lot from different DEM offerings.
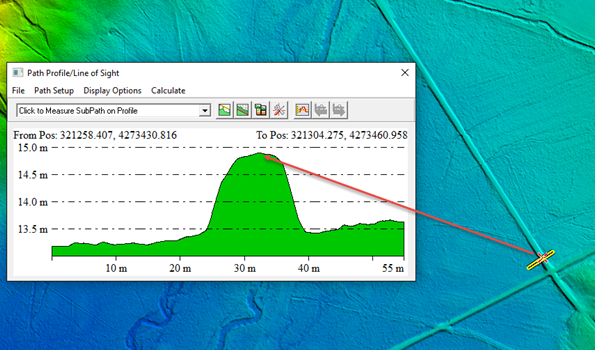
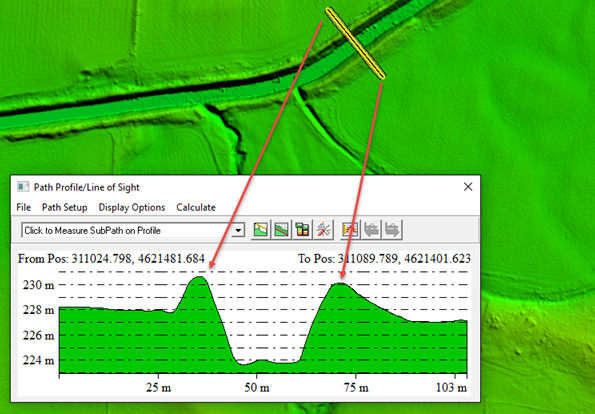
Figures 1 and 2 show two examples of 1m-resolution LiDAR-derived DTM for flood-prone areas, where roads and river banks/levees are clearly represented and accurately measured. Small ground features can be captured in LiDAR point clouds, and a very high spatial resolution (say finer than 1m) should be chosen for their effective representations in DEM. LiDAR-derived DEM has become the standard dataset for detailed and more accurate flood modelling worldwide.

Figure 2: Road features shown in LiDAR-derived DTM. Data source: USGS 3DEP
Figure 3: River features shown in LiDAR-derived DTM. Data source: USGS 3DEP


