Mapping Flood Risk in Australia
Often you might be faced with too much or too little flood information. We develop a range of accessible flood information products to help you investigate flood risk at a site level and assess how reliable the flood data source might be.

Two Additional Tools to Advance Flood Risk Analytics at Scale in Australia

Web Maps – API Subscription Plans
(PDF)

Advancing Flood Risk Analytics with Location Profile APIs and Web Services – 3 New Info Products

Applications of New National Contour Web Maps: Part 2 (Identifying Low-lying Coastal Areas)

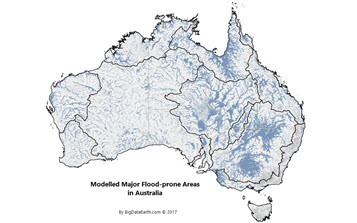
Applications of New National Contour Web Maps: Part 3 (Identifying Riverine Flood-prone Areas)

New Tile Maps on Terrain and Hydrology: Part 3 (Increasing Details)
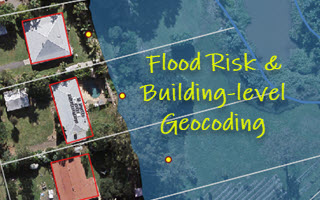
Building-level Geocoding for Regional Flood Risk Analysis: A Case Study in Ipswich, Queensland

Mapping the Coastal Settlement in Wamberal, NSW: Two Approaches
Three New Tools for Investigating Flood-prone Areas. Check the Importance of Data Quality on Elevation.

Creating Building Footprints and Terrain Features for Web and Desktop Mapping: With Examples from the NSW Coast
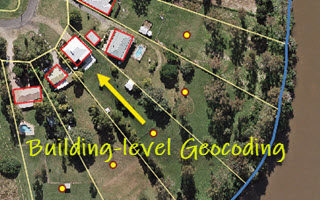
Building-level Geocoding of G-NAF (Address Database) for Improved Flood & Bushfire Risk Analysis in Australia
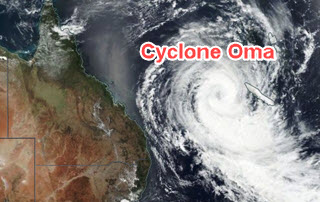
The February 2019 Tropical Cyclone Oma, Australia
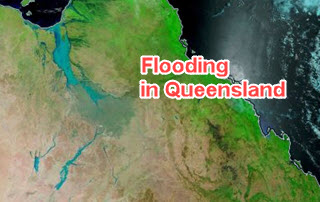
Some Exposure Analysis in Relation to the February 2019 Flooding in West & North-West Queensland
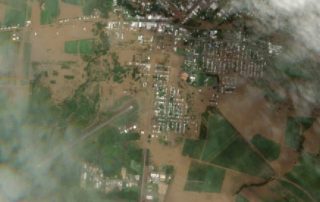
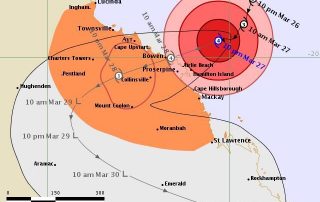
The March 2018 Major Flooding in North Queensland, Australia