25 September 2018
For flood risk assessment, one may develop flood hazard maps directly or just use existing maps which are often associated with modelled hazard return periods. The quality of each flood map is up to a range of factors, such as the quality of elevation and rainfall inputs, modelling methods, and the scope of flooding. One can always find differences among the flood maps supplied by individual vendors even the same input is used for the same study area. In other words, there are various levels of uncertainties in flood mapping. Questions are often raised, e.g.
- Is the conventional flood map a panacea?
- Is the flood risk score for a single location enough?
- What are the new information products for flood mapping in this technology-rich era or in 10-20 years?
- How can we see the quality of each input, so we can be more confident of what has been used?
- Can any contextual insights about flooding be included?
- Can we easily see many inundation scenarios especially in relation to the dangerous warming climate?
As a new effort to advance flood risk analytics, we developed a major project titled “Introducing Three New Tools for Investigating Flood-prone Areas in the U.S. and Australia” last year and released a set of related Location Profile APIs recently, including:
- au-location-analytics (API reference)
- au-flood-analytics (API reference)
- us-location-analytics (API reference)
- us-flood-analytics (API reference)
For a flood-prone location in Australia and in the Contiguous U.S., API-enabled, site-level location profile report and animation can be produced for innovative flood risk analytics, which are fully complementary to existing flood mapping. Independent developers for property location and hazard risk information can integrate the accessible APIs in any third-party applications, so the information and insights revealed be readily shared with the general public and decision makers. For example, these web pages (e.g. Link 1 and Link 2 with Google Maps embedded) are created to allow users to request analytical reports and animations automatically. The Developer Portal provides instructions on how to implement APIs at scale.
This blog showcases the APIs and information products that are available for site-level flood risk analytics.
1. Location Profile Report for Flood-prone Addresses
The report is applicable to assessing any type of flooding (e.g. riverine, coastal or flash).
Site-level location profile report for #Wrightsville Beach, North Carolina#Hurricane #Florence #HurricaneFlorence pic.twitter.com/oxXiTb29Yr
— BigData Earth (@BigDataEarth) September 14, 2018
2. Flood Animation by Elevation
Because the majority of floods worldwide take place in flat or low-lying areas, to have this simplified information product is always handy and useful. We usually use GIF animation for this, but a multi-page PDF file (each page showing potential inundation at a given elevation level) can also be generated.
1 – Flood-prone areas in #Ingham, #QLD
Major #flood Warning for the #Herbert River @BOM_Qldhttps://t.co/xC0fY8Q9Cw@QldFES @ABCemergency @abcbrisbane pic.twitter.com/jE89r1cb8i— BigData Earth (@BigDataEarth) March 11, 2018
3. Flood Mapping by Inundation Depth
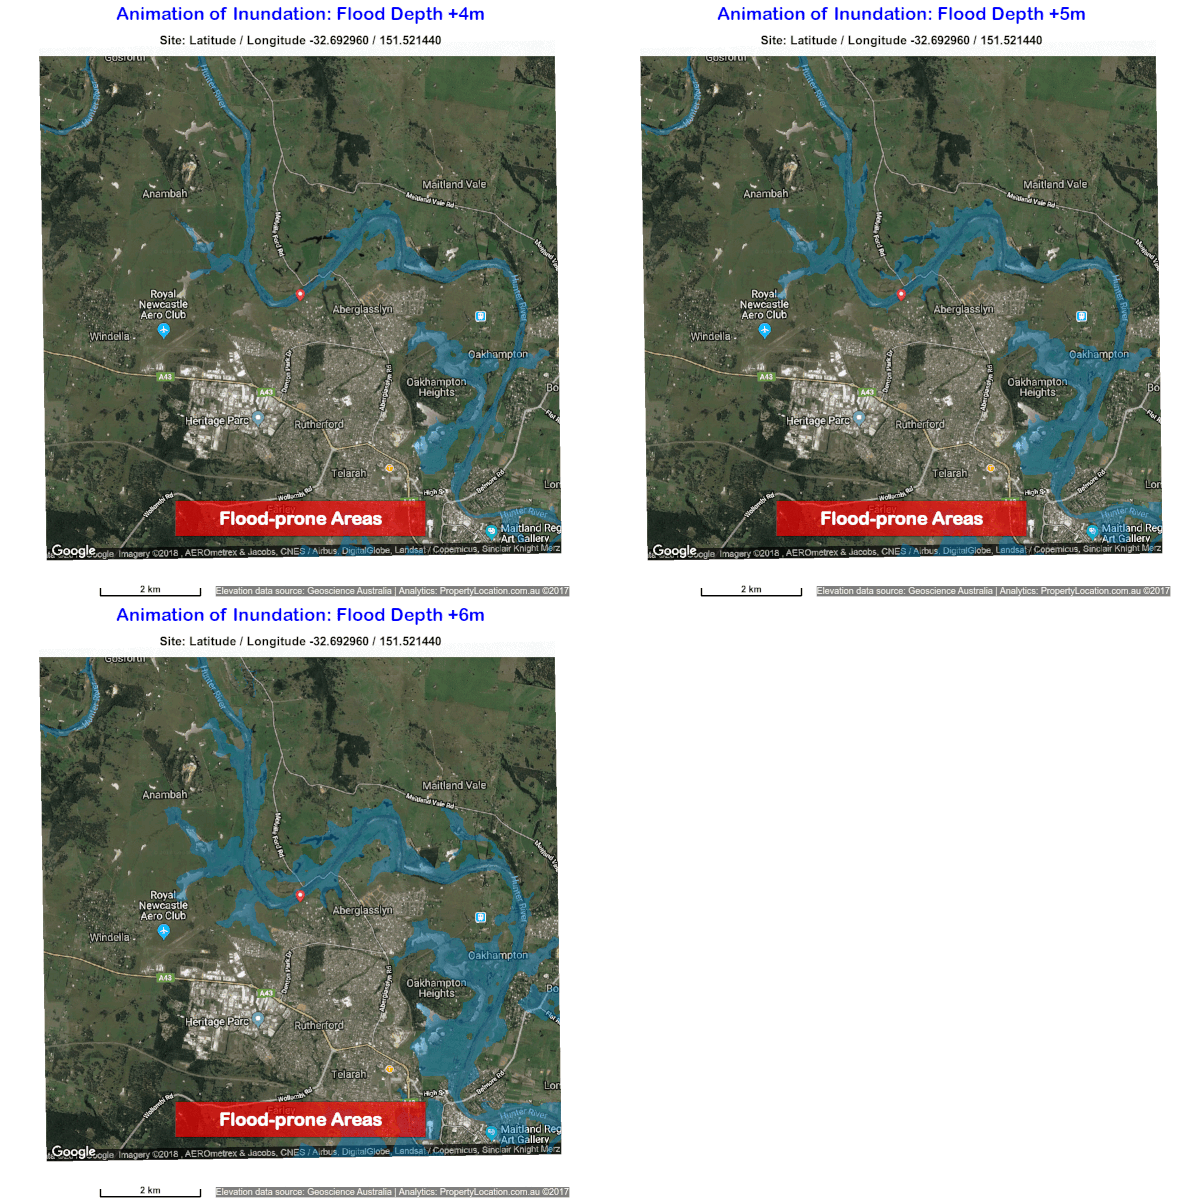
There could be numerous realisations for this, all up to the settings of a particular flooding process. Here we simulate probable inundation scenarios that flood extent expands as flood depth (relative to the river elevation represented by the input DTM) increases. The result is in either a GIF animation or a multi-page PDF file.
Likewise, we can use any third-party existing flood hazard maps (with various return periods) and produce similar dynamic animations with slightly modified APIs.

