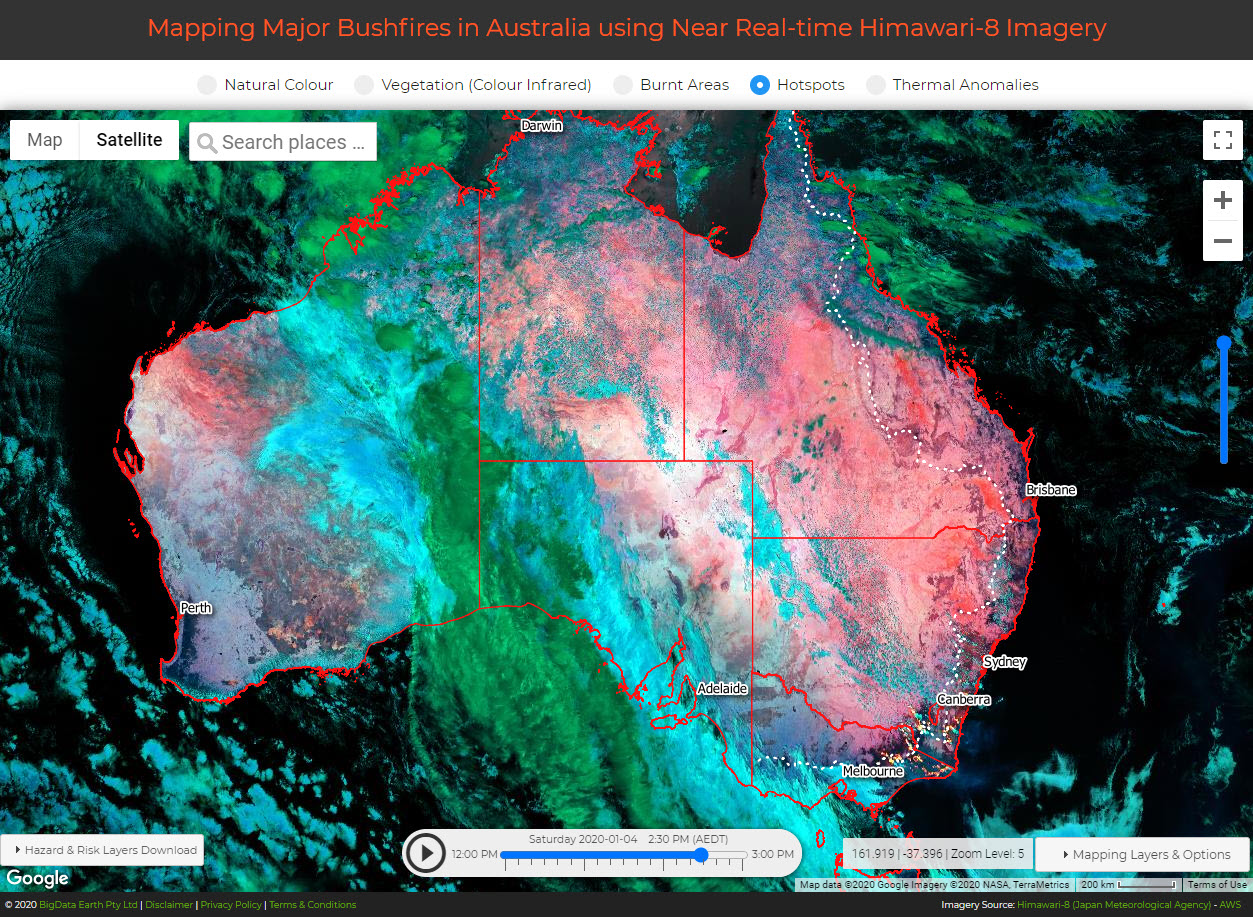
Mapping bushfires using Earth observation (EO) imagery has been a very active research and application field. With a strong determination to advance bushfire studies using new data and technologies, we have carried out this comprehensive project – Mapping Major Bushfires in Australia using Near Real-time Himawari-8 Satellite Imagery. The project consists of six major parts, each with significant investment:
1. Develop New Software to Rapidly Process Himawari-8 Imagery
2. Revisit Major Fire Days in the 2019-20 Bushfire Season using Himawari-8 Imagery
3. Set up Web Services to Serve Processed Himawari-8 Imagery at Scale
4. Create a Bushfire Mapping App to Visualise the Latest Himawari-8 Imagery
5. Extract Bushfire Hotspots from Himawari-8 Imagery
6. Exposure and Risk Analysis using the Latest Bushfire Hazard Information
1. Develop New Software to Rapidly Process Himawari-8 Imagery
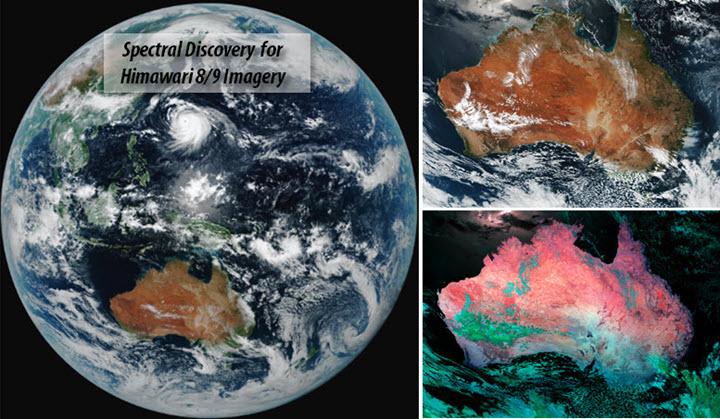
The potential of near real-time Himwari-8 imagery for hazard mapping has long interested us at BigData Earth. Himawari-8 satellite provides 16 spectral bands (at 0.5 – 2 km spatial resolutions) and full-disk observations every 10 minutes (except 2:40 and 14:40 UTC for satellite’s own housekeeping operations). We have developed dedicated software called Spectral Discovery for Himwari-8 Imagery (link) which can rapidly process the time series of Himawari-8 imagery. The software tool includes the following four functions:
-
Rapid image band combinations
-
Adaptive image stretching
-
Advanced image fusion
-
Exploratory feature (e.g. fire hotspots) extraction
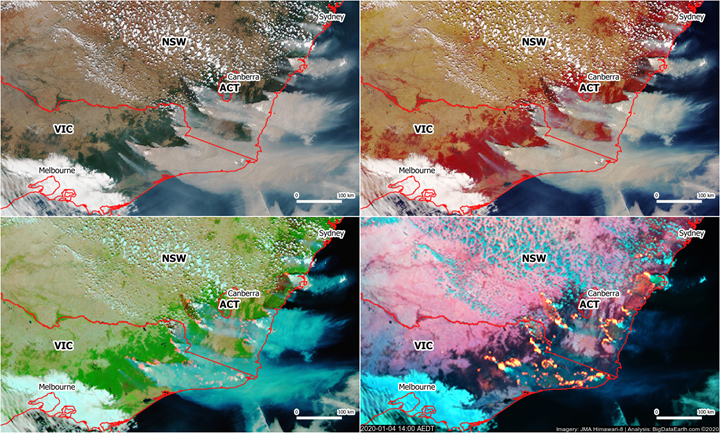
For bushfire mapping, we analyse multispectral Himawari-8 imagery and produce four composite images (in addition to the mid-infrared Band 07 at 3.9 μm, 2 km resolution), each highlighting a different aspect of bushfires (Figure 1):
-
Natural colour – using visible bands and ideal for monitoring smoke from fires
-
Vegetation – in colour infrared and healthy vegetation shown in red
-
Burnt areas – using short-wave and infrared (SWIR) bands
-
Hotspots – using mid-infrared & SWIR bands
-
And, thermal anomalies – using mid-infrared Band 07 alone
All composite images are resampled and processed at 1 km resolution. As the first three composite images involve one or more visible bands, they are provided during the day only. The composite image on hotspots and stretched image on thermal anomalies (in black/white) are provided day and night.
Figure 1: Analysing Himawari-8 imagery to highlight different features of interest (e.g. smoke, vegetation, burnt areas or fire scars, and hotspots) in bushfire mapping. Example: Catastrophic bushfires in SE Australia on 4 January 2020. Animation video available on  (full-resolution version upon request)
2. Revisit Major Fire Days in the 2019-20 Bushfire Season using Himawari-8 Imagery
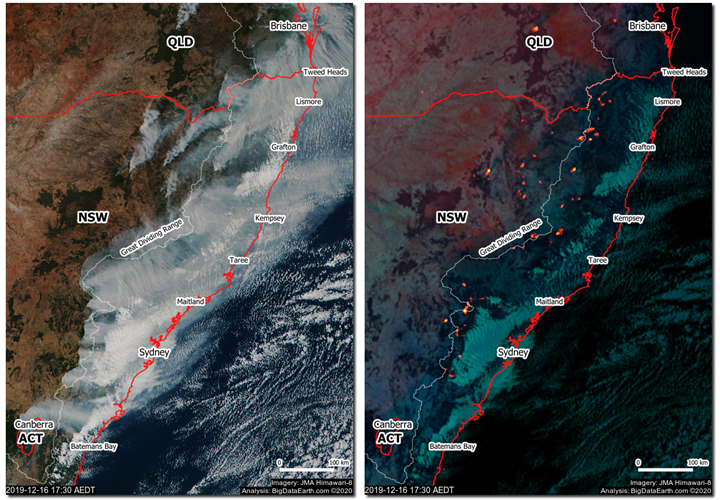
Sadly, the unprecedented 2019-20 Australian bushfire season (Black Summer) caused many fatalities and devastating property and infrastructure losses. This recent fire history needs to be documented in detail. From an Earth observation perspective, we use historical Himawari-8 imagery to revisit and systematically record all major fire days in the 2019-20 season. Figure 2 shows an example of the raging fire in NSW on 16 December 2019.
3. Set up Web Services to Serve Processed Himawari-8 Imagery at Scale
The latest near real-time Himawari-8 imagery becomes available on AWS about 11 to 17 minutes after the start of the imagery acquisition. For example, if Himawari-8 sensors (Advanced Himawari Imagers – AHIs) start to take full-disk imagery on 3 pm, the imagery data will be accessible around 3:11 – 3:17 pm. Afterwards we start automated image analysis to rapidly process the multispectral bands of the Himawari-8 imagery. Significant efforts have been made to optimise the whole processing workflow (with software and cloud resources) in order to complete the related task within 3 minutes (i.e. by 3:20 pm using the above example). We endeavour to achieve <20-minute latency for the latest Himawari-8 imagery to be available (in the form of web delivery) relative to its initial capture. (From trial tests over the past few months, only very rarely are certain 10-min snapshots not available or not delivered on time as expected due to unknown reasons, but this issue is very minor and negligible.)
Two main image analysis tasks performed:
-
Creating Himawari-8 composite images for the whole Australian region. Then turn RGB images into separate mapping tiles at four zoom levels (web mapping zoom levels 5-6-7-8, corresponding to ~4.8-2.4-1.2-0.6 km spatial resolutions on the ground, respectively).
-
Extracting hotspots of major bushfires. Then turn hotspots data into feature layers.
As a result, about 8,500 map tiles/files and a dozen other output files are produced for the Himawari-8 imagery every 10 minutes. More than six web services have been deployed to set up an efficient mapping infrastructure so that all outputs can be delivered via APIs very quickly for web and desktop mapping.
3A: For composite images in XYZ tiles, access URLs can be either of the following:
curl https://api.RiskMapping.com.au/h8/{year}/{month}/{day}/{hhmm}/{tileset}/{z}/{x}/{y}.[jpg | png] -H apikey=[x]
or, with a single URL address:
https://api.RiskMapping.com.au/h8/{year}/{month}/{day}/{hhmm}/{tileset}/{z}/{x}/{y}.[jpg | png]?&apikey=[x]
Tile maps can be easily integrated with web or mobile mapping applications (those using Google Maps APIs, Leaflet APIs, OpenLayers APIs, Mapbox APIs, etc.), by updating related URLs.
3B: For composite images in GeoTIFF and hotspot feature layers in three formats (Shapefile, GeoJSON and KML), API URLs follow similar formats. All these mapping outputs, in an original imagery projection, can be directly linked to or downloaded by users for customised mapping.
The timely Himawari-8 imagery would assist rapid response teams to make time-critical decisions and the general public to raise situation awareness during emergencies. The new imagery available every 10 minutes, like radar images and loops in weather apps, has the potential to be incorporated into emergency & public warning apps (e.g. Fires Near Me app from NSW Rural Fire Services).
4. Create a Bushfire Mapping App to Visualise the Latest Himawari-8 Imagery
We create this web app with emergency operations in mind, by focusing on the excellent temporal resolution (10 minutes) of the Himawari-8 imagery. Processed imagery for the immediate past period (20 mins to 3:20 hours) is shown in the app by default.
Hotspots, even for smaller and lower-intensity fires, could be manually interpreted and identified from Himawari-8 images. We facilitate that process by placing a time slider into a central position in the app; users can drag the time slider to more easily track the movement of fires (Figure 3).
The app can switch between two modes: Demo (using historical fires, Figure 3) and Live.
Figure 3: A new bushfire mapping app displaying Himawari-8 composite images (national coverage).
(Animation video)
5. Extract Bushfire Hotspots from Himawari-8 Imagery
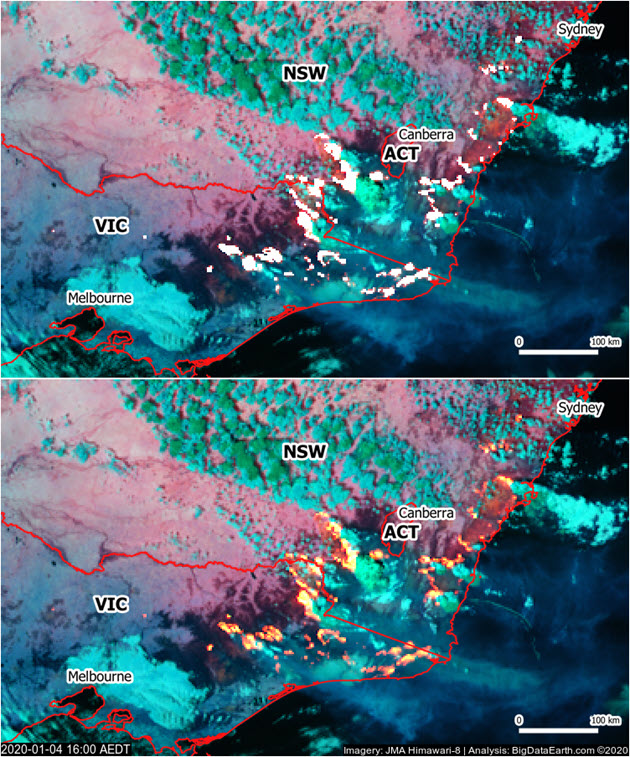
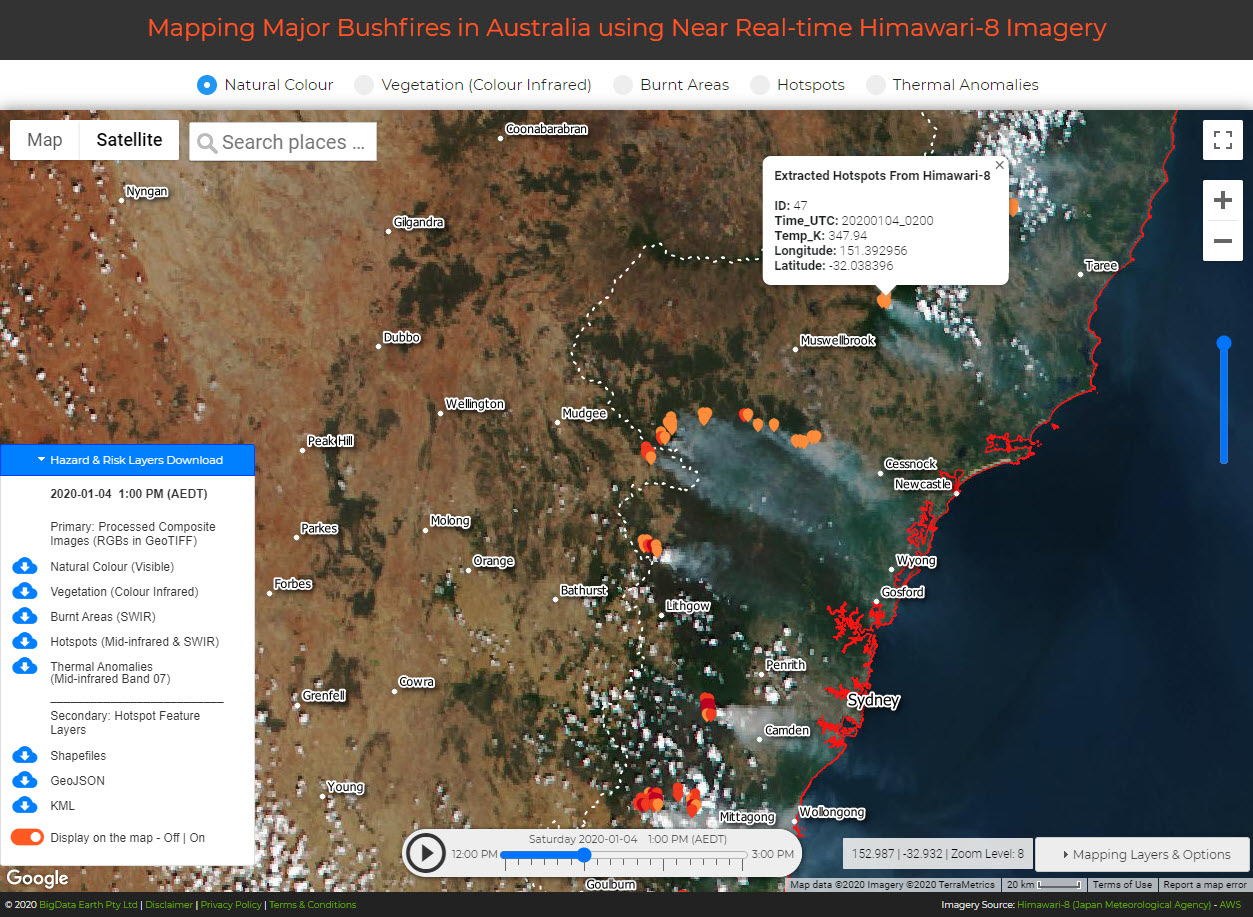
This is among the most popular research topics in relation to Himawari-8 imagery and fire monitoring. We have prepared a separate blog on this (Detecting Bushfire Hotspots from Himawari-8 Imagery: With Four Examples from the 2019-20 Australian Bushfire Season, link). Figure 4 shows an example of automated extraction of bushfire hotspots from a time series of Himawari-8 imagery on 4 January 2020.
The mapping app can display extracted hotspots instantly and users can make a direct comparison against the underlying composite imagery. Figure 5 shows an example of extracted hotspots with a number of attributes (e.g. timestamp and brightness temperatures) currently included.
Feature extraction in image processing would involve some small percentages of errors or false alarms; it is impossible to ascertain a perfect accuracy about the extracted features. The use of such data poses a number of issues (e.g. clarity and liability) for public-facing applications. On the other hand, active major bushfires shown by thermal anomalies in satellite imagery are quite distinctive and can be identified relatively easily even by a lay person. Most current hotspot information is quite abstract and it is ideal to combine with related images which can show the size, intensity and movement of major fires (assuming cloud cover is not an issue here).
For public warning apps, it would be more effective to use Himawari-8 composite images as a primary data source to show the latest fire hazard information (at least at the regional level), instead of hotspot feature layers (a secondary data source) which are subject to uncertainties. A paradigm shift might be needed on this aspect.
