We offer data & analytics services to aid rapid response to major events, such as disasters and emergencies.
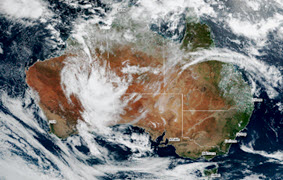
In this blog, we showcase our efforts in response to a number of major events in Australia during the summer week of 20-26 January 2021. A range of information products related to a tropical low, a multi-day heatwave and bushfires were quickly produced and shared. On each case, various cloud-based products and solutions we have developed using Web APIs, Apps and Maps technologies greatly enabled efficient analysis and rapid delivery of results.
Event #1: The 20-21 January 2021 Bushfires in Western Australia
Bushfires in the Shires of Nannup and Dundas were closely monitored using the near real-time Himawari-8 imagery. Timely geospatial data about composite images and extracted hotspots was generated.
#Bushfire Emergency Warning this late afternoon – evening local time, in the SHIRE OF #NANNUP (~250 KM south of #Perth) #WesternAustralia
Date: 20 January 2021
Image source: #Himawari8 imagery available every 10 mins@dfes_wa @ABCemergency #bushfires #Australia pic.twitter.com/PEEBUSbaY1— BigData Earth (@BigDataEarth) January 20, 2021
#Bushfires in the Shire of #Nannup & the Shire of #Dundas this afternoon, #WesternAustralia
Date: 21 January 2021
Image source: #Himawari8 imagery available every 10 mins@dfes_wa @ABCemergency #bushfires #Australia pic.twitter.com/gII2aY6TrA— BigData Earth (@BigDataEarth) January 21, 2021
Event #2: The 22 January 2021 Tropical Low in NW Australia
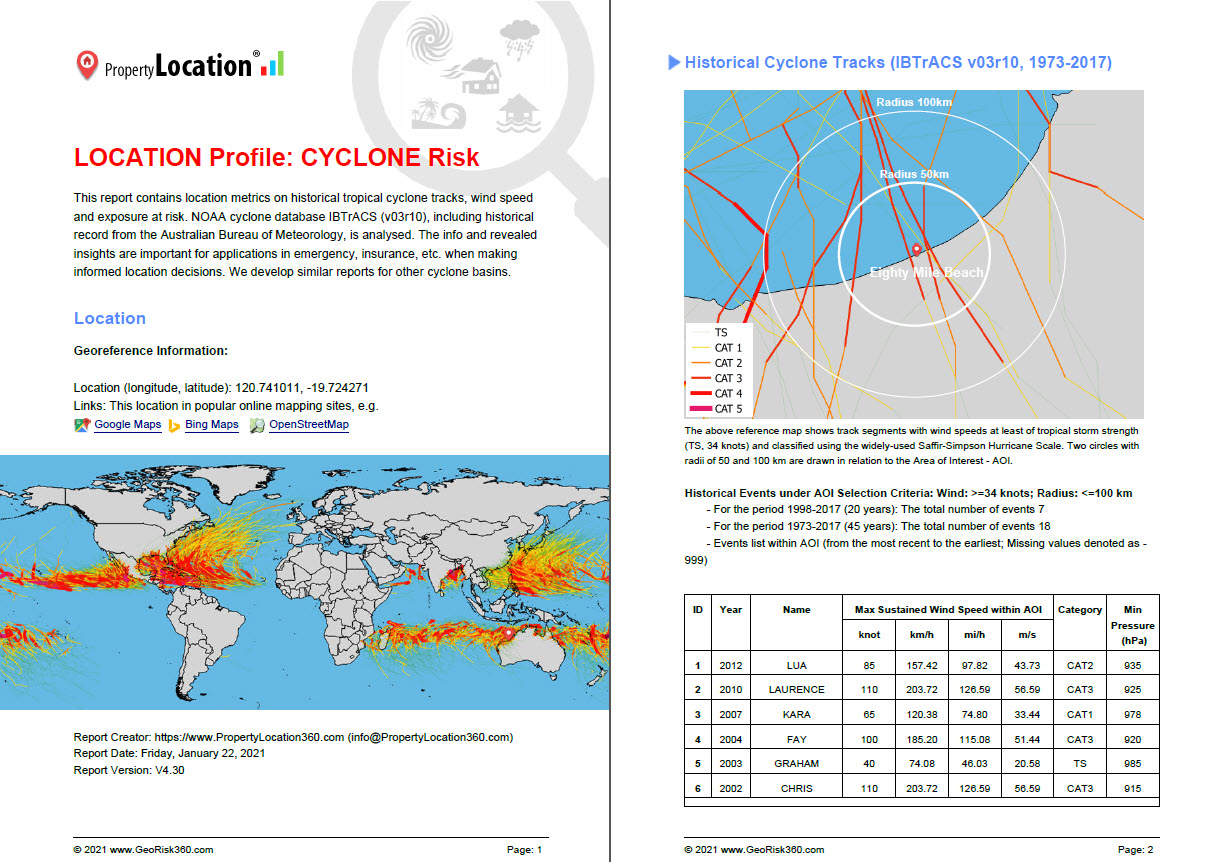
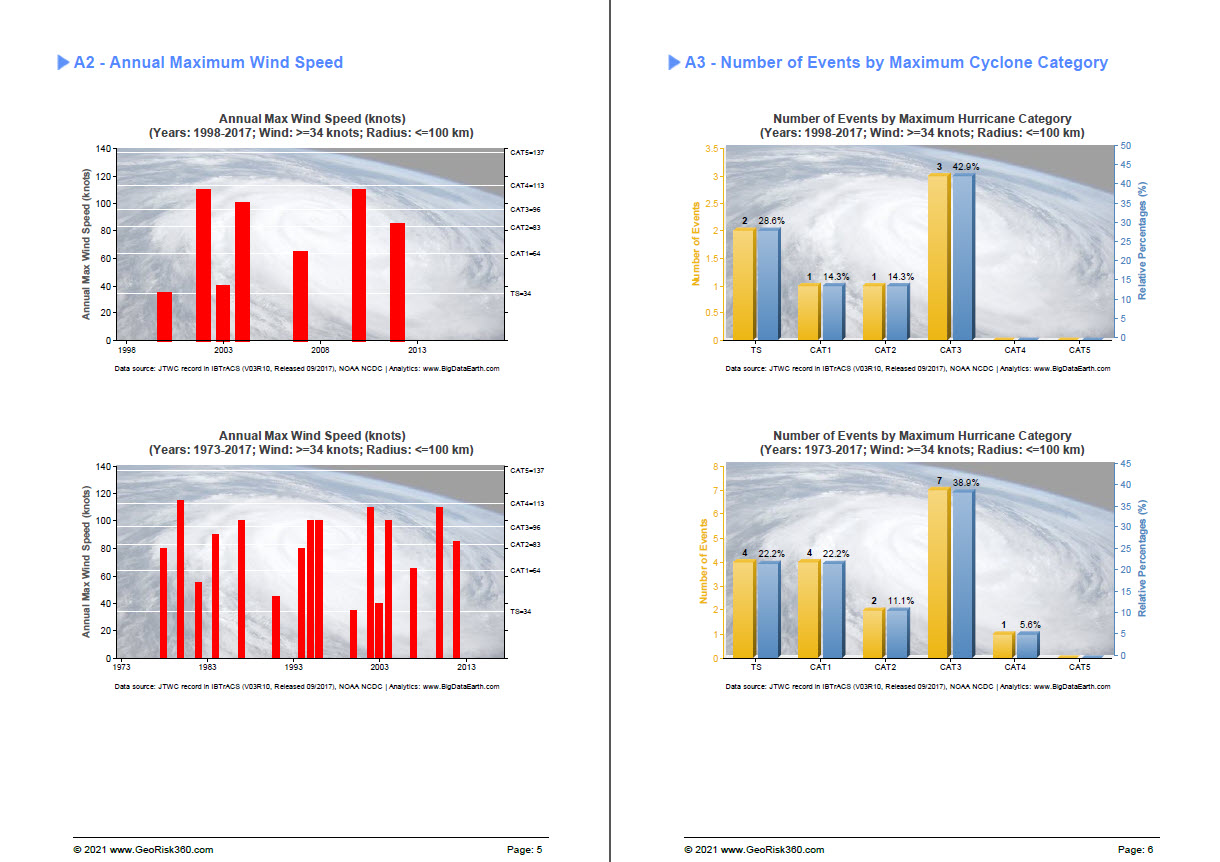
A tropical low off the northwest of WA made landfall on Friday 22 January 2021. We produced Location Profile Reports to show historical tropical cyclone tracks, wind speed, etc. location metrics (Figure 1).
Figure 1: Tropical Cyclone Location Profile Report containing a comprehensive set of location metrics
Event #3: The 22-26 January 2021 Heatwave
Two videos were prepared to help understand this widespread summer heatwave in southern and eastern Australia.
Hot, dry air from the vast outback was pushed towards southern and eastern Australia, by an additional force this time (i.e. a tropical low and remnants in the west).
The top animation shows the changes of brightness temperatures from morning to evening over the five-day period. The brightness temperature here is inferred from the mid-infrared thermal band of the Himawari-8 imagery; warmer colours represent higher temperatures. The bottom animation shows a natural-colour view.
Figure 2: Using the time series of Himawari-8 imagery available every 10 minutes to illustrate the evolution of the 22-26 January 2021 heatwave. Top: Brightness temperatures inferred from the mid-infrared thermal band of the Himawari-8 imagery; Bottom: A natural-colour view. (Full-resolution version is available upon request)
Event #4: The 24 January 2021 Bushfire in Adelaide Hills
A major bushfire in the Adelaide Hills broke out and grew very quickly in the late afternoon. We monitored and tracked the event from the very onset using the near real-time Himawari-8 imagery available every 10 minutes. Three information products were produced in time in response to this event:
– Animation about bushfire hotspot changes using Himawari-8 imagery
– Detected bushfire hotspots as a geospatial feature layer
– Location Profile Report (31-page PDF) showing measured context and location metrics about the impact area
#Bushfire CHERRY_GARDENS & HICKS_HILL_ROAD #adelaide
– Dynamics of the fire hotspots over the immediately past 2.5 hours. Date: 24/01/2021@CFSAlerts @SAPoliceNews @SA_Ambulance@ABCemergency @DFIT_SA#heatwave #bushfires #Australia pic.twitter.com/p387wxLLsK
— BigData Earth (@BigDataEarth) January 24, 2021


