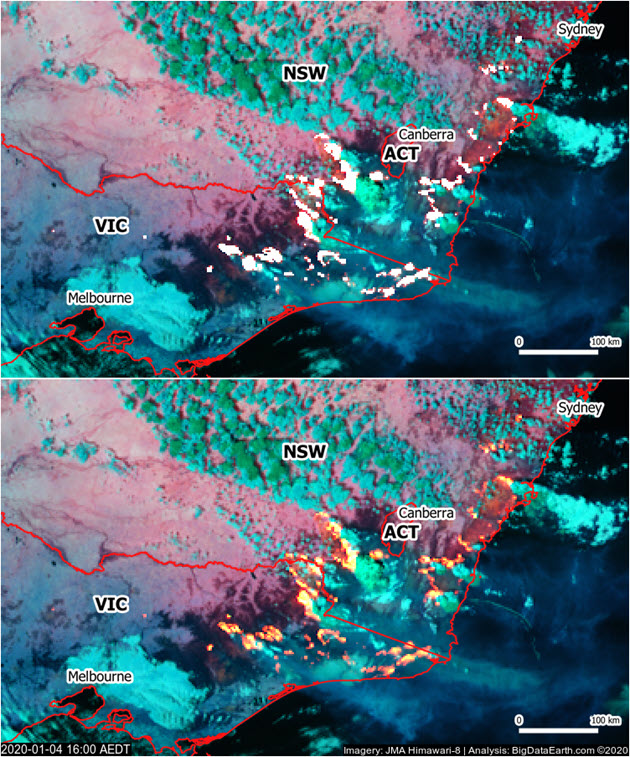
The new generation of geostationary meteorological satellites, such as Himawari-8 from the Japan Meteorological Agency (JMA, link), offer much improved capabilities of monitoring large-scale weather events in the atmosphere and phenomena on the Earth’s surface. Himawari-8 sensors (Advanced Himawari Imagers – AHIs) are equipped with 16 spectral bands: 3 visible bands at 0.5 – 1 km resolution, 3 near-infrared bands and 10 infrared bands at 1 – 2 km. The time interval of Himawari-8 full-disk observations is 10 minutes (except 2:40 and 14:40 UTC saved for AHI housekeeping operations). With such a high frequency or temporal resolution (10 mins vs. those of polar-orbiting satellites, e.g. hours by MODIS and VIIRS, five days by Sentinel-2 and 16 days by Landsat-8), Himawari-8 imagery has been increasingly explored to monitor and map large forest fires in east Asia and western Pacific regions. In Australia, many universities and agencies (including BOM, Bushfire & Natural Hazards CRC and SmartSat CRC) have been involved making contributions to this field.
The potential of near real-time Himwari-8 imagery for hazard mapping has long interested us at BigData Earth. We have developed software called Spectral Discovery for Himwari-8 Imagery (link) for this. The software tool performs rapid image band combinations, adaptive image stretching, advanced image fusion and exploratory feature (e.g. fire hotspots) extraction. This blog introduces some of our R&D in this area, which is part of a comprehensive project of mapping major bushfires in Australia using Himawari-8 imagery (link). Images from the following four extreme fire days in the unprecedented 2019-20 Australian bushfire season (Black Summer) are used in this blog:
-
16 December 2019
-
31 December 2019
-
3 January 2020
-
4 January 2020
1. Bushfire Hotspot Representations in Satellite Imagery
Bushfire hotspots of various sizes can be clearly recorded in higher-resolution satellite imagery (e.g. Sentinel-2 at 10 m and Landsat-8 at 15 m). In comparison, coarse-resolution Himawari-8 imagery can measure large fires only, although theoretical research and overseas case studies suggest that small fires with the size less than one hectare could also be represented and detectable. This very basic difference on image resolutions vs. feature sizes dictates subsequent image analysis and potential applications, including feature selections, algorithms development and accuracy assessment.
Hotspots can be characterised by at least five aspects: size, density, spatial patterns, intensity and movement. Here we make direct comparisons of hotspots derived from Sentinel-2 and Himawari-8 composite images, for some of the extreme fire days in the 2019-20 bushfire season. It might be useful to broadly classify hotspots in three dominant shapes: points, lines and polygons (Figure 1).
The overall spatial patterns of hotspots from two image sources agree very well, but not exactly. For locations with large, clustered and high-intensity fires (shown in yellow in hotspot composite images), the agreement is overwhelming. For areas with scattered or lower-intensity fires, the correspondence becomes mixed. This is understandable given the coarse (2 km) resolution of the mid-infrared thermal band of the Himawari-8 imagery. At 10 m resolution level, hotspots are apparent and clear-cut, but at 2 km resolution, hotspots may also be shown by neighbouring pixels as well. The thermal heat from active fires (via radiation, convection and conduction) would spread out in the vicinity subject to local environmental conditions such as wind speed / directions and topography.
The implication of the above comparison is that when using Himawari-8 imagery, one should be aware of that the location accuracy of hotspots is only approximate (about 2 km); it is reasonable to put a higher confidence in pixels showing high-intensity fires.

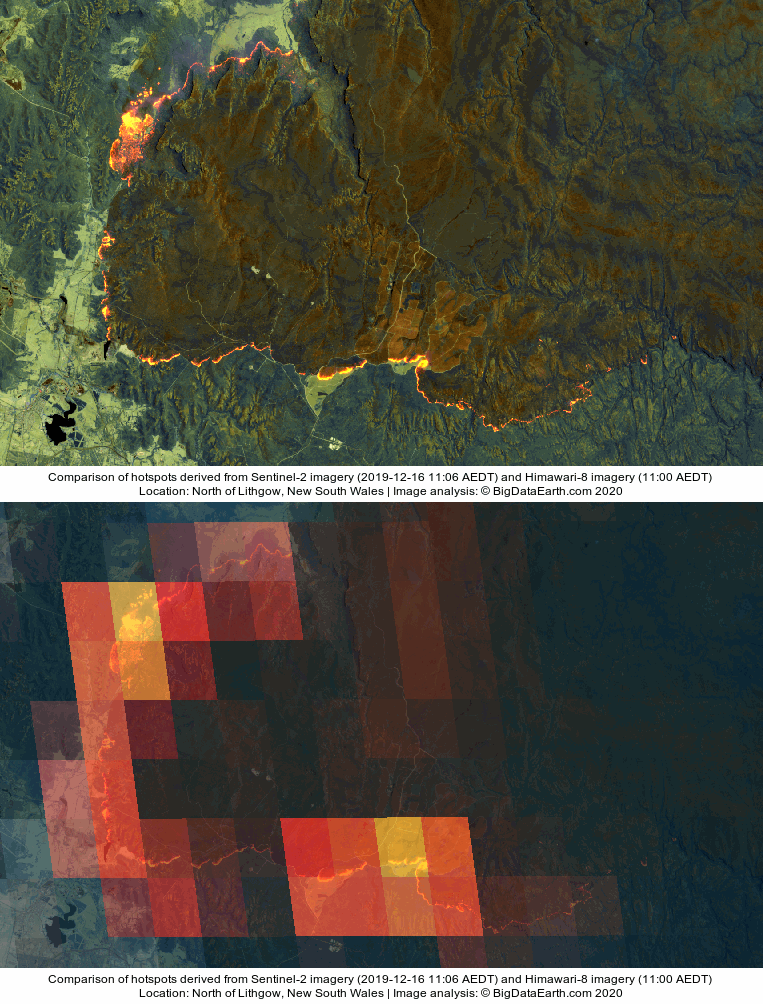
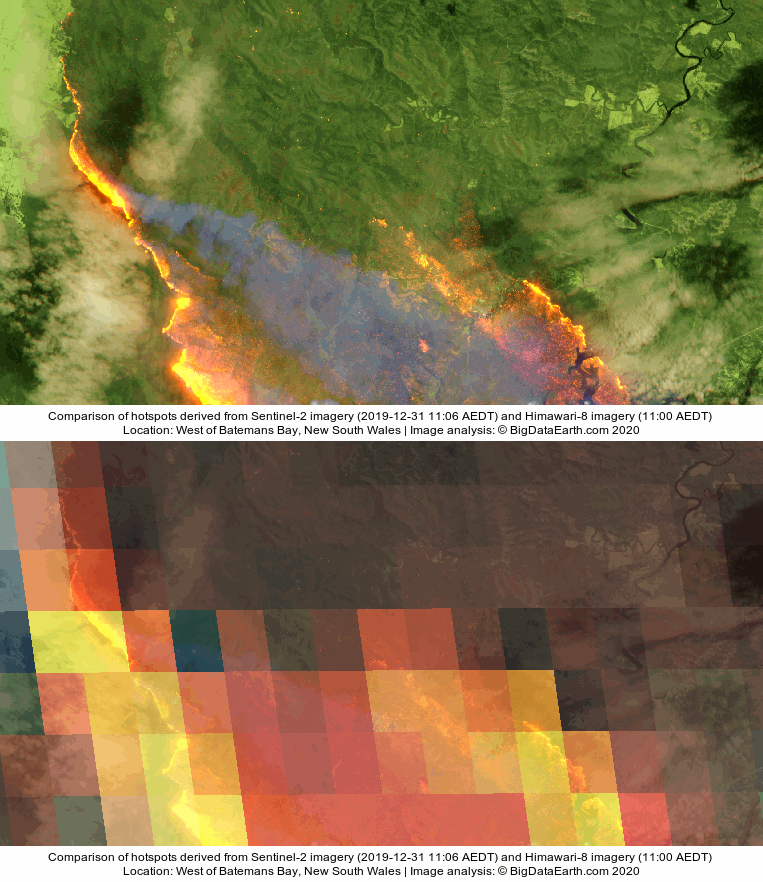
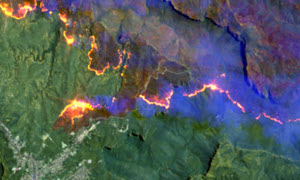
Figure 1: Comparison of hotspots derived from Sentinel-2 imagery (at 10m resolution) and Himawari-8 imagery (at ~2 km resolution). Top: fires near Hotham Heights and Dinner Plain, Victoria (2020-01-03, our previous reporting on the fire using Sentinel-2 imagery link); Middle: fires north of Lithgow, NSW (2019-12-16, link); Bottom: fires west of Batemans Bay, NSW (2019-12-31, link).
2. Detecting Bushfire Hotspots
Identifying forest fires (by detecting hotspots, smoke, etc.) from satellite imagery is a popular topic, and the past few decades have seen many research papers on this. To achieve a very high accuracy of hotspot detection using mid-infrared thermal bands (e.g. Himawari-8’s Band 07 at 3.9 μm), near-infrared and/or visible bands has never been a straightforward task. Some important considerations include:
-
Hotspots can be varying in size and intensity. What are those thresholds to define a hotspot? Understanding the feature of interest and its representation in imagery is fundamental.
-
The detection method developed for a specific imagery source or dataset may not be generic.
-
The detection method suitable for a specific spatial and temporal domain may not work for other regions or days.
-
Do we have large-sized, high-resolution observational data for validation?
-
Is the detection accuracy good enough for real-world applications?
-
Can the near real-time detection result greatly assist emergency operations?
- …
We make serious efforts to develop suitable methods for automated fire hotspot detection. For higher-resolution imagery (e.g. Sentinel-2 and Landsat-8), detection results can be easily verified against the input imagery. But for coarse-resolution Himawari-8 imagery, it is not always clear-cut to validate detection results.
Various thresholding methods, statistical machine learning (e.g. logistic regression) and artificial neural networks have been tested and evaluated. Figure 2 shows an example (based on a neural network model) of predicting hotspot probabilities after taking into account Himawari-8 thermal band, near infrared bands, and spectral signals of smoke, clouds and vegetation. (The task of hotspot detection is closely related to the detection of fire smoke and clouds). Our conclusion is that even a satisfactory detection model is built, one still needs to select a critical yet subjective threshold to “define” (include / exclude) hotspots. To minimise false positives, a relatively large (conservative) threshold has to be chosen.
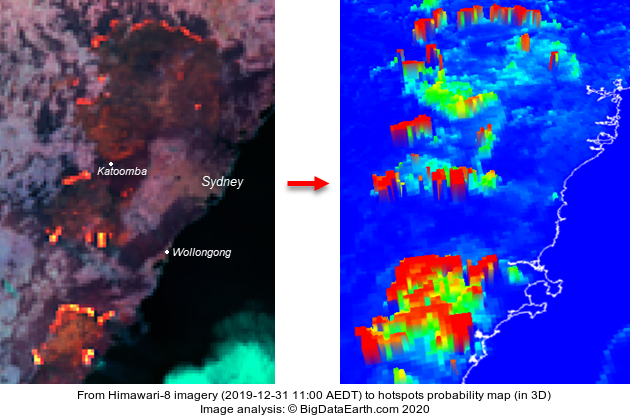
Figure 2: Image analysis turning Himawari-8 imagery into a hotspot probability map (red colours represent probabilities close to one). A threshold has to be chosen to “define” hotspots.


