2 April 2020
Sentinel-2 (with twin satellites Sentinel-2A and Sentinel-2B) is one of the most successful Earth observation missions from the EU Copernicus Programme and ESA. Sentinel-2 satellite imagery features:
-
wide swath (290km)
-
multiple spectral bands (13 bands)
-
high resolution (four visible and near-infrared bands at 10m, six red-edge/shortwave-infrared bands at 20m, and three atmospheric correction bands at 60m)
-
high revisit frequency (5 days at the Equator)
The imagery data has been openly available since late 2015. We have developed unique Spectral Discovery software to rapidly make colourful and detail-rich Sentinel-2 imagery composites at 10m resolution. Main functions include:
-
Band combination
-
Image stretching
-
Image fusion or pan-sharpening
-
Exploratory image feature extraction (e.g. with NDVI – vegetation Index, NDWI – water index)
1. Access to Public Sentinel-2 Imagery Data
Nowadays there are many ways to obtain Sentinel-2 imagery data quickly, e.g.
-
ESA’s Copernicus Open Access Hub – https://scihub.copernicus.eu/
-
Sentinel Hub’s EO Browser – https://www.sentinel-hub.com/explore/eobrowser
-
Amazon Web Services – https://registry.opendata.aws/sentinel-2/
-
Google Cloud Platform –
https://cloud.google.com/storage/docs/public-datasets/sentinel-2
-
USGS EarthExplorer – http://earthexplorer.usgs.gov/
-
Copernicus Australasia – http://www.copernicus.gov.au/
If you have been working with remote sensing imagery, chances are you may already have your own favourite ways of obtaining Sentinel-2 imagery data in no time!
2. Rapidly Processing Sentinel-2 Imagery with Spectral Discovery Software
While the imagery data is magnificent, more work needs to be done on how to process the imagery data in a very quick and straightforward way.
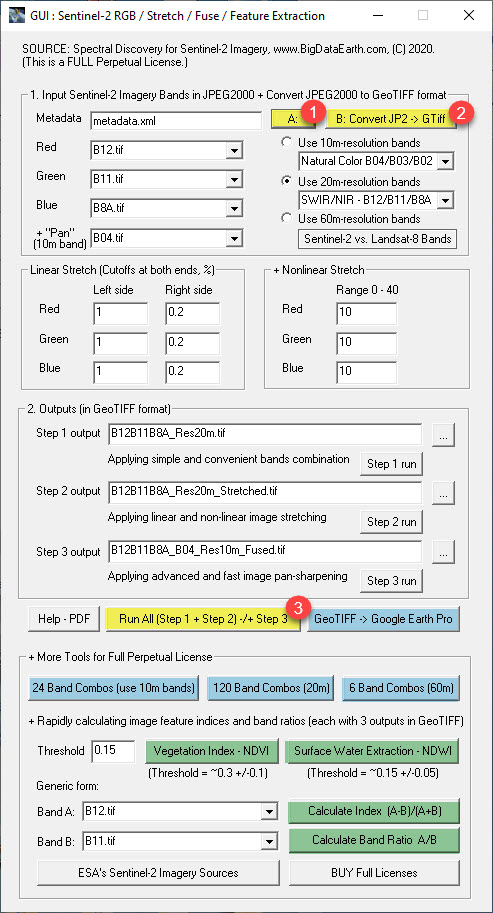
The Spectral Discovery software developed contains a series of DOS- and GUI-based modules. For example, to run GUI (Figure 1) with three simple button clicks one can perform the following functions:
-
Button 1: Select metadata file (*.xml) of your downloaded Sentinel-2 imagery, and the rest of GUI fields will be populated automatically.
-
Button 2: Convert downloaded imagery data in JPEG2000 format to uncompressed, analysis-ready GeoTIFF format.
-
Button 3: Run three steps altogether (band combination, image stretching, and image pan-sharpening) to produce output files in popular GeoTIFF format.

Figure 1: Spectral Discovery software GUI (Version 03/2020)
3. Visualising Processed Imagery
The processed imagery in GeoTIFF format can be directly mapped or displayed in other software, including:
-
Google Earth Pro
-
GIS and remote sensing software (e.g. QGIS, ArcGIS, MapInfo, Global Mapper, ENVI, PCI, ERDAS IMAGINE, and eCognition)
-
Numerous consumer-level image editing software (e.g. Adobe Photoshop and Microsoft Paint)
4. Applications
Spectral Discovery software has been used to process Sentinel-2 imagery for a wide range of environmental applications, including:
-
Land cover changes (e.g. deforestation, coastal dynamics, and urban expansion)
-
Natural hazards and emergencies (e.g. fire scar mapping, flooding, and volcanic eruption)
-
Mining exploration and mineral detection (e.g. with SWIR bands)
-
Agricultural and vegetation mapping (e.g. with NDVI)
-
Water quality monitoring
-
Updating GIS basemaps using the latest, fresh satellite imagery
For example, we have applied the software to map the recent 2019-2020 bushfires in Australia:
Early spring #bushfires south of #Yamba (Clarence Valley LGA, NSW, Australia) captured by today’s Sentinel-2 imagery on 09:54AM local time, 2019-09-09@NSWRFS #nswrfs #nswfires@CopernicusEU @CopernicusEMS@ABCemergency @FRNSW pic.twitter.com/g06zH83bs5
— BigData Earth (@BigDataEarth) September 9, 2019
2020-01-05 update: #Bushfires in the World Heritage-listed Blue Mountains National Park #NSW #Australia, seen by Sentinel-2 satellite today on 11:06 AM local time.
Image source: @CopernicusEMS @CopernicusEU#Katoomba #nswrfs #nswfires#AustralianBushfire #AustraliaOnFire pic.twitter.com/LWV2DJIJEj
— BigData Earth (@BigDataEarth) January 5, 2020
The software has also been used to map wildfires, floods, landslides and volcanic eruptions taking place around the world:
-
Blog – Monitoring Major Events with Global Earth Observation and Geospatial Big Data Analytics: 10+ New Examples (link)
