Quite a few coastal properties in Wamberal (NSW) are at risk of constant coastal erosion. This is again heightened by the threat from two Australian East Coast Lows affecting the NSW coast in recent few weeks.
Two independent approaches, together with high-resolution public data sources, can be used to map the coastal settlement.
1. LiDAR-based Geospatial Approach
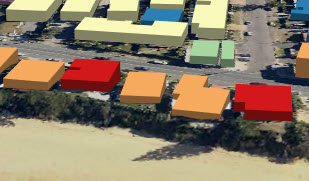
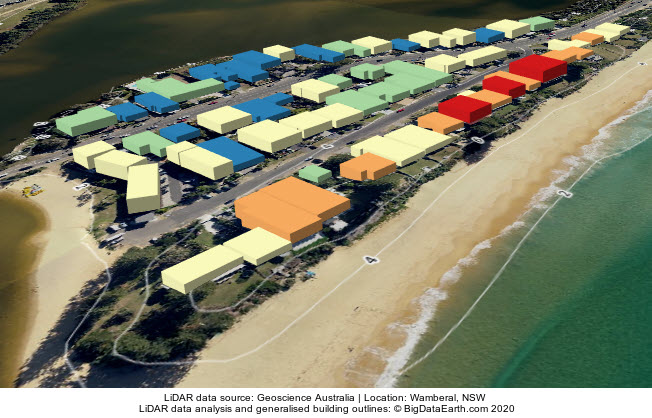
We use LiDAR data available at Geoscience Australia (link). Generalised building footprints are modelled from dense LiDAR point clouds and then average roof heights for individual buildings estimated (Figure 1).

Figure 1: Generalised building footprints modelled from LiDAR data. Location: Wamberal, NSW.
2. Imagery-based AI Approach
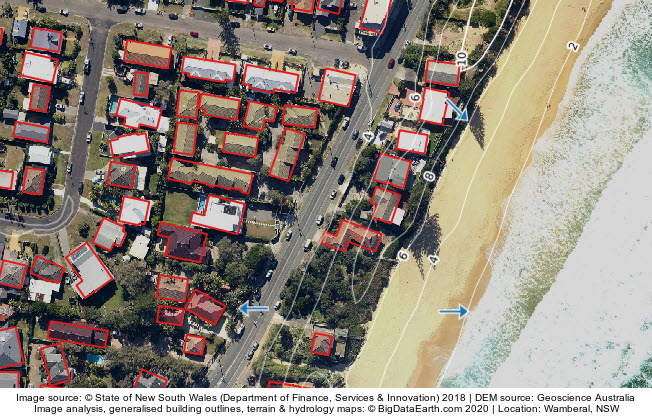
Open imagery data is available at NSW Spatial Services (link). High-resolution aerial imagery and a deep learning technique are used to map building footprints (Figure 2), and our previous blog covers this topic.

Figure 2: Generalised building footprints extracted from high-resolution imagery. Location: Wamberal, NSW.
