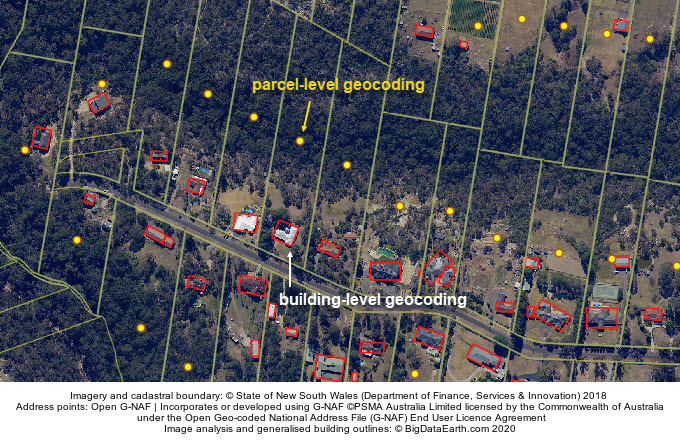
It is well known that exposure location is a major source of uncertainties in either site-level or aggregate risk analysis. Back in 2016, we released a product called Geocoding DoubleCheck (link) to address the location accuracy of parcel-level geocoding. Then we compared the difference between parcel-level and building-level geocoding (Figure 1), and stressed the importance of using high-resolution imagery to geocode exposure data objectively.
Parcel-level geocoding: The geometric centroid of a land parcel (polygon) is used to represent the location of an address.
Building-level geocoding: The geocoded location is indicated by the footprint of a physical building and/or a point within. It is also known as rooftop-level geocoding.

Figure 1: Comparison between parcel-level and building-level geocoding.
Address points are from Open G-NAF: Incorporates or developed using G-NAF ©PSMA Australia Limited licensed by the Commonwealth of Australia under the Open Geo-coded National Address File (G-NAF) End User Licence Agreement
In Australia, the widely-used Geocoded National Address File (G-NAF) is based on parcel-level geocoding; i.e., using polygon centroids to represent address locations. (Please refer to one of our recent blogs for more features of G-NAF, link) This level of geocoding is not accurate enough for addresses associated with large land parcels, which are typically at urban interfaces (e.g. areas close to bushland or rivers) and regional areas. The accuracy of geocoding has serious implications for location-sensitive applications, such as flood and bushfire risk analysis.
This has motivated us to develop a large-scale project that re-geocodes G-NAF at a building level. The use of high-resolution imagery, together with new AI and deep learning techniques, allow us to determine where buildings are located within land parcels. We are now able to do this for very large regions, and details are provided in the previous blog (link).
1. Illustration – Geocoding Differences in the Context of Flood and Bushfire Risk Analysis
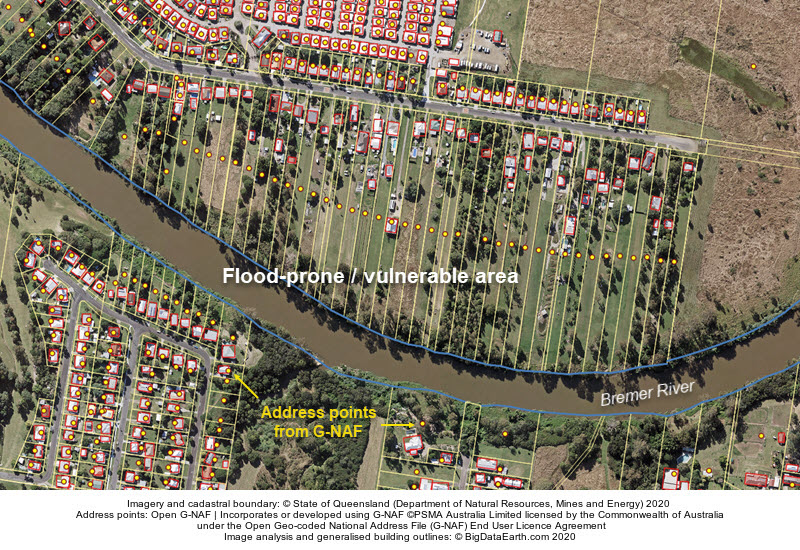
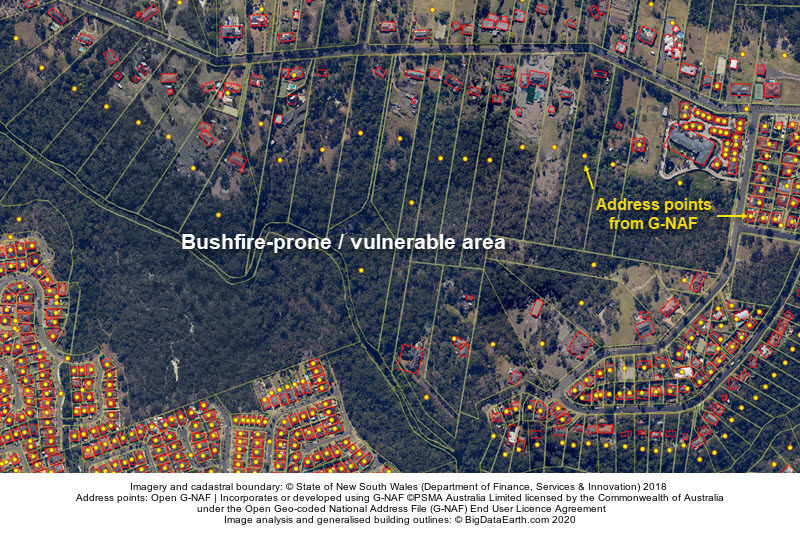
Figures 1 and 2 show a set of addresses represented by land parcel centroids and physical buildings. The centroids here are from Open G-NAF and generalised building outlines from our own image analysis. It is clear that in these cases, there is a tendency to overestimate flood or bushfire risk for many addresses. On some other cases, risk could be underestimated if the exposure location is based on centroids.
Figure 2: Flood-prone addresses geocoded at either land parcel (centroid) level or building level. Location: Ipswich, Queensland.
Figure 3: Bushfire-prone addresses geocoded at either land parcel (centroid) level or building level. Location: Sydney, NSW.
After all, the issue illustrated above is quite simple in concept, and what is needed most is an efficient implementation which can adjust G-NAF addresses from centroids to buildings. In our AI / deep learning image analysis, we produce generalised building outlines (in the form of minimum bounding box), from which new representative points specific to physical buildings are derived.
We have sourced the open imagery publicly available from state/territory government agencies to locate buildings. It is not necessary to use very new imagery in this project as buildings usually have fixed locations over many decades anyway. For newly developed areas, we can work with fresh imagery for quick updates.
2. Building-level Geocoding of G-NAF Address Points in Most Flood- and Bushfire-prone Regions
The location accuracy of exposure data will have a direct impact on risk quantification and will improve the transparency of risk modelling significantly. This has been long acknowledged. Our priority is to re-geocode those G-NAF addresses in most flood- and bushfire-prone regions across the country. We see this is a practical approach as those regions usually contribute to the majority of risk.
So far we have performed building-level geocoding for residential addresses in two major flood-prone regions (having the largest concentration of flood-prone addresses in the country):
-
Brisbane River and Bremer River in Brisbane and Ipswich, respectively
-
Hawkesbury-Nepean River in western Sydney


