3 June 2019
We keep demonstrating the potential use of new national contour web maps that have been developed in a recent flood risk analytics project (link). Previous blogs in this series include:
-
Applications of New National Contour Web Maps: Part 1 (Enhancing High-resolution Imagery Mapping) – link
In this blog we illustrate the use of high-resolution contour web maps to identify low-lying coastal areas, which are susceptible to storm surges, sea-level rise, erosion and tsunamis. While there have been many other research in relation to coastal vulnerability, we believe the new web maps provide a refreshing and convenient tool to delineate low-lying coastal areas and exposure at risk (before, during and after emergencies) very tangibly.
Main features of the new maps:
-
Large coverage, not limited to a single small area.
-
Scalable maps with multiple zoom levels.
-
All national maps being consistently styled.
-
Easy integration with web, mobile or desktop mapping.
-
Instant access and rapid delivery as all maps were pre-processed.
Information about map coverage and access is in the original article (link).
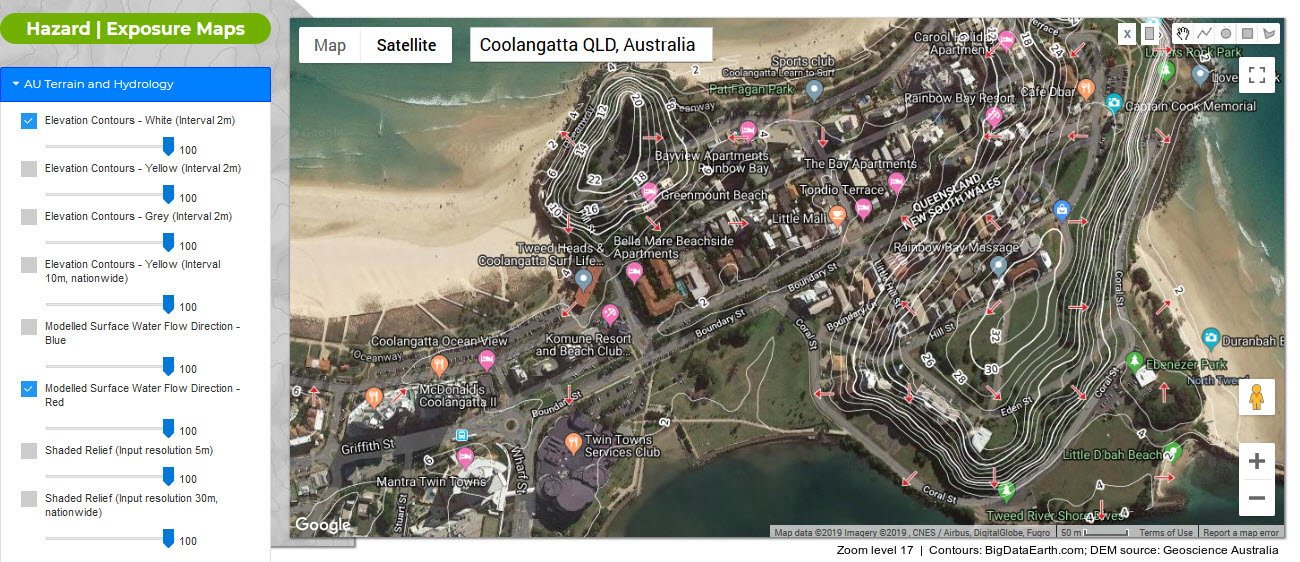
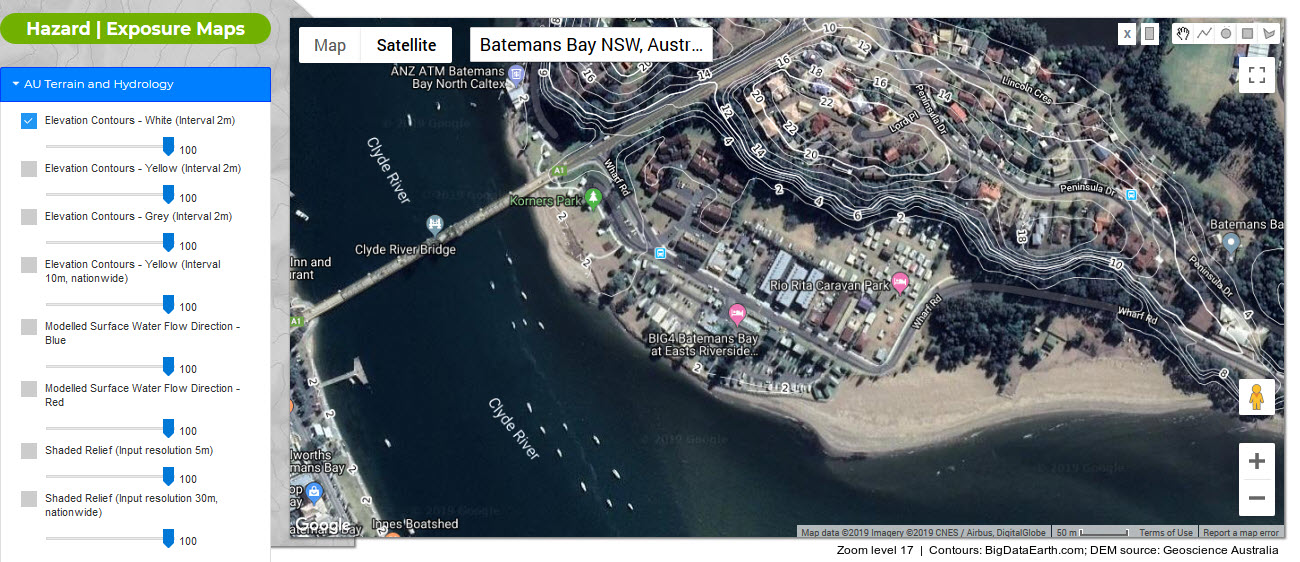
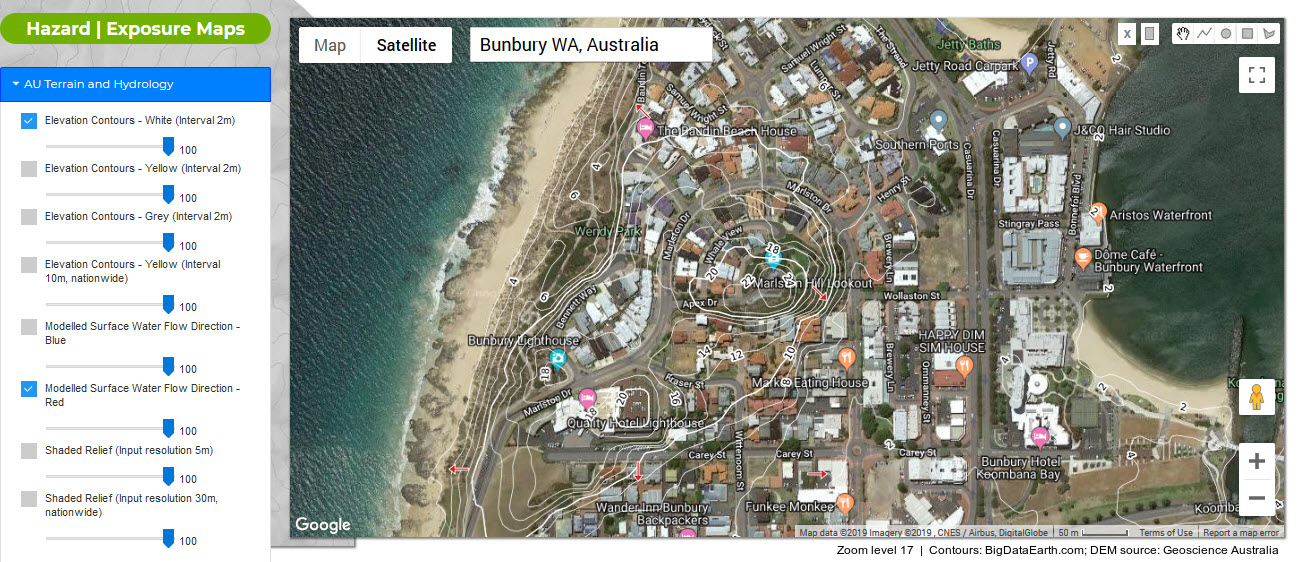
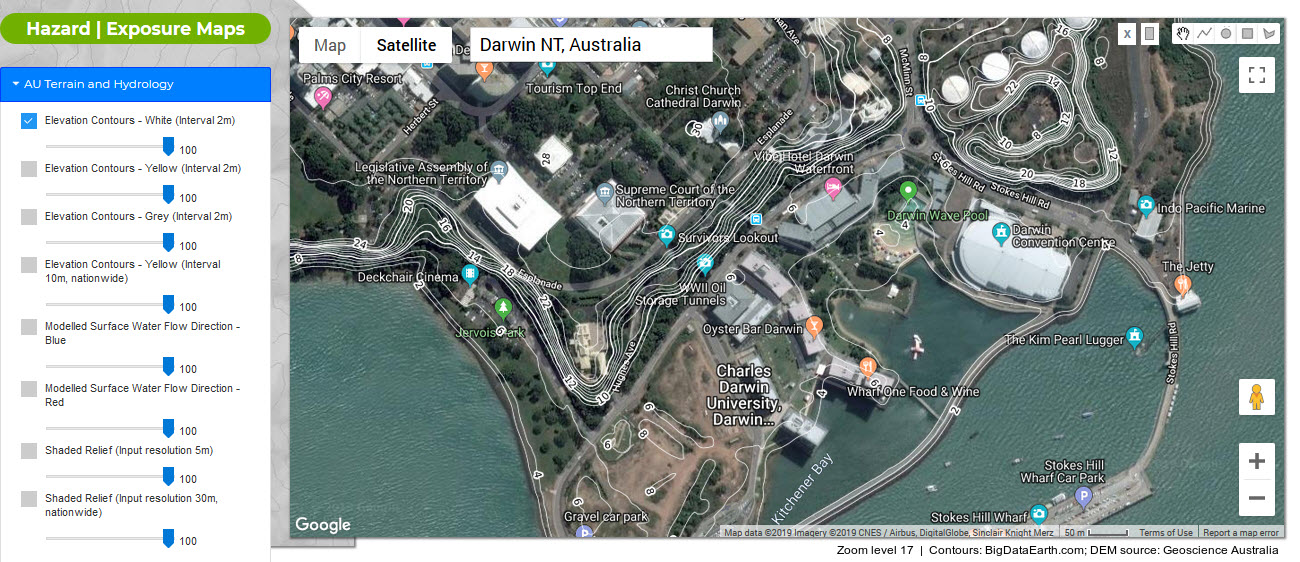
We select six coastal cities across the country for illustration, and respective contour maps (overlay with Google Maps imagery) are shown in Figures 1-6. Please click each figure for a full-resolution version. If you need similar maps for your area of interest, just let us know.
-
Mackay, QLD
-
Coolangatta, QLD
-
Newcastle, NSW
-
Batemans Bay, NSW
-
Bunbury, WA
-
Darwin, NT
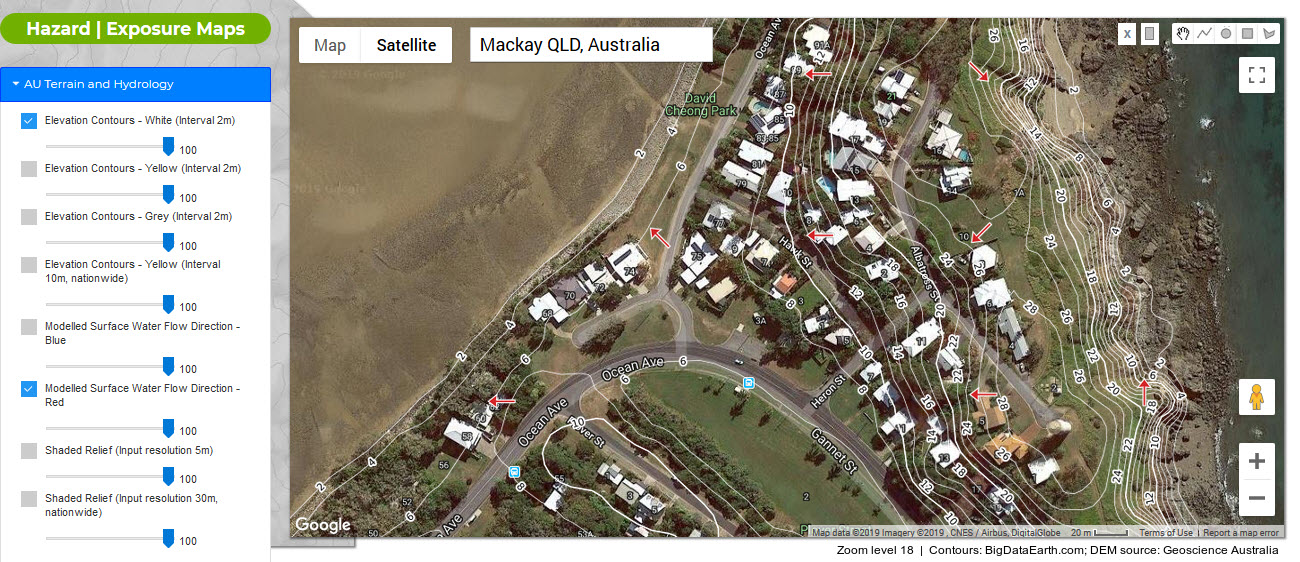
Figure 1: Example of the new contour web maps (Mackay, QLD; Zoom level 18 displayed)
Figure 2: Example of the new contour web maps (Coolangatta, QLD; Zoom level 17 displayed)
Figure 3: Example of the new contour web maps (Newcastle, NSW; Zoom level 16 displayed)
Figure 4: Example of new contour web maps (Batemans Bay, NSW; Zoom level 17 displayed)
Figure 5: Example of new contour web maps (Bunbury, WA; Zoom level 17 displayed)
Figure 6: Example of new contour web maps (Darwin, NT; Zoom level 17 displayed)


