30 May 2019
In the previous blog, we reported a national flood risk analytics project that has produced a set of high-resolution tiled web maps on elevation contextual layers and terrain metrics, including contours, modelled surface water flow directions and shaded relief. These web maps are also complementary to desktop, web or mobile mapping. In this blog, we demonstrate that the new contour web maps can be used to greatly enhance high-resolution imagery mapping.
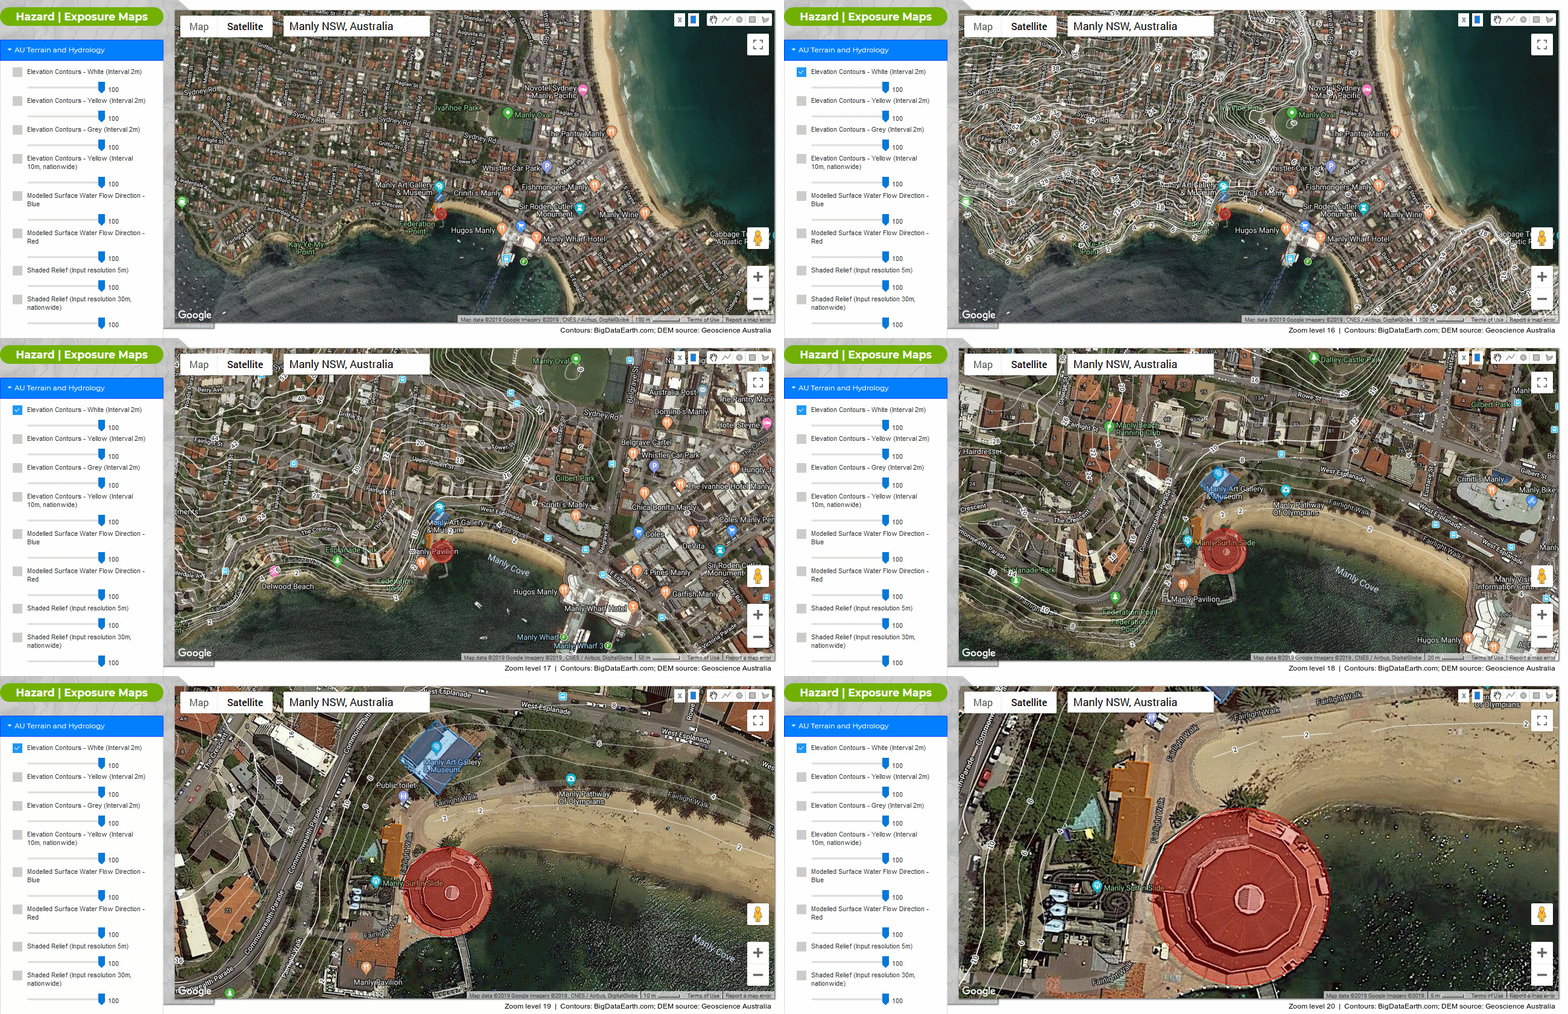
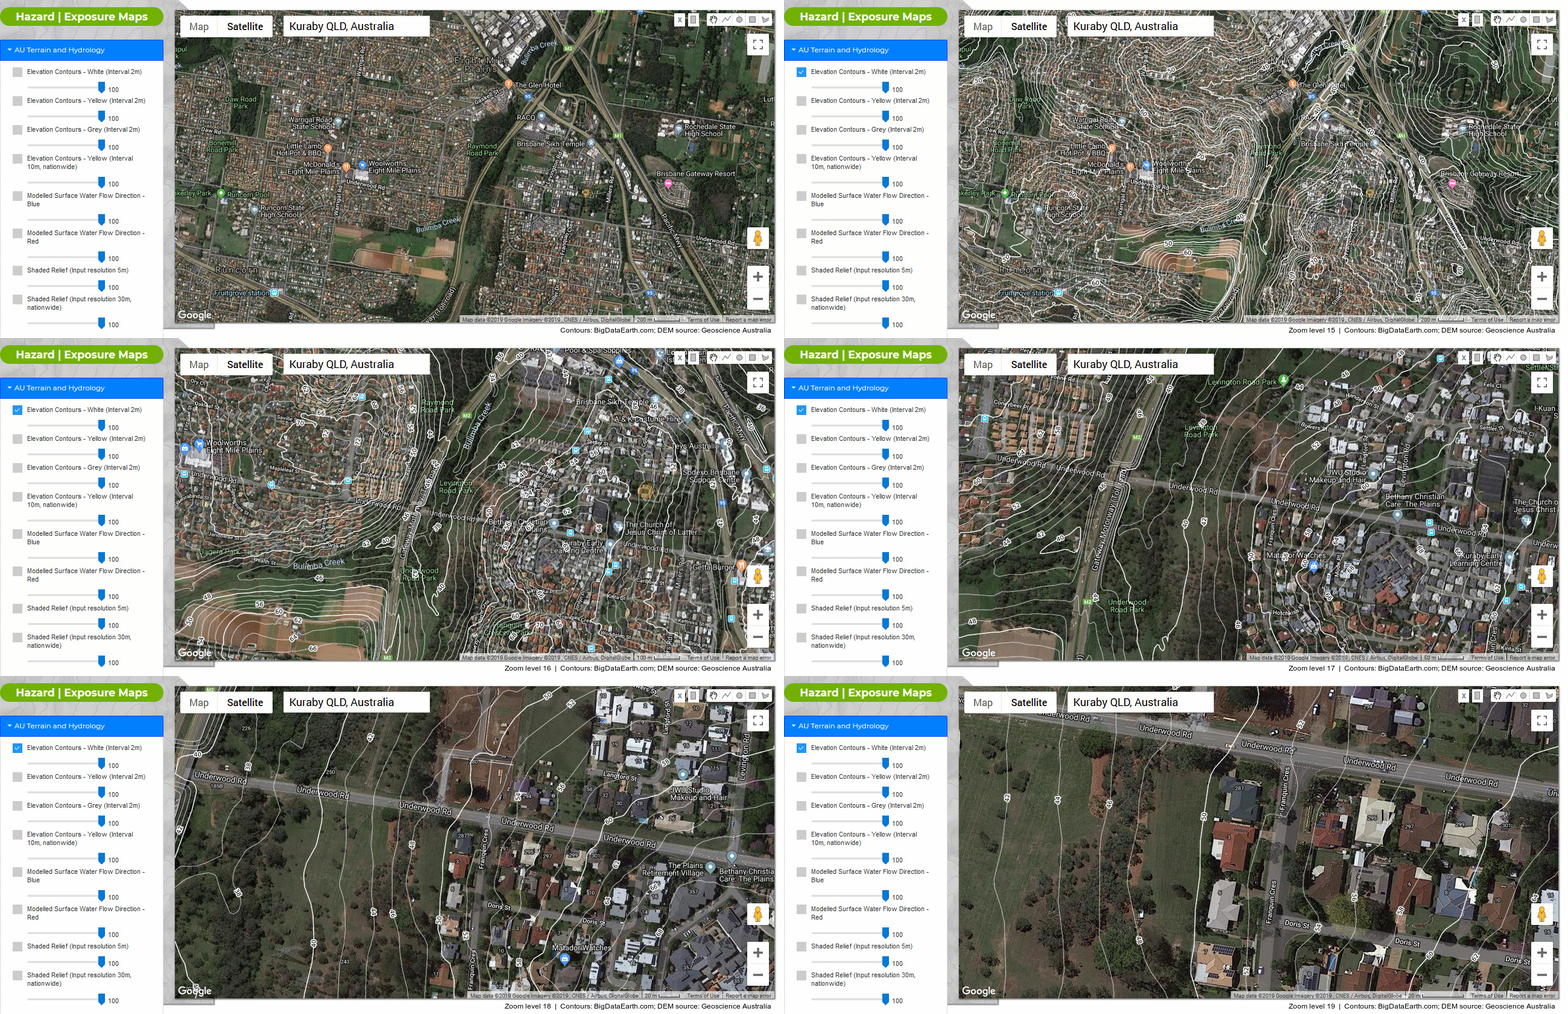
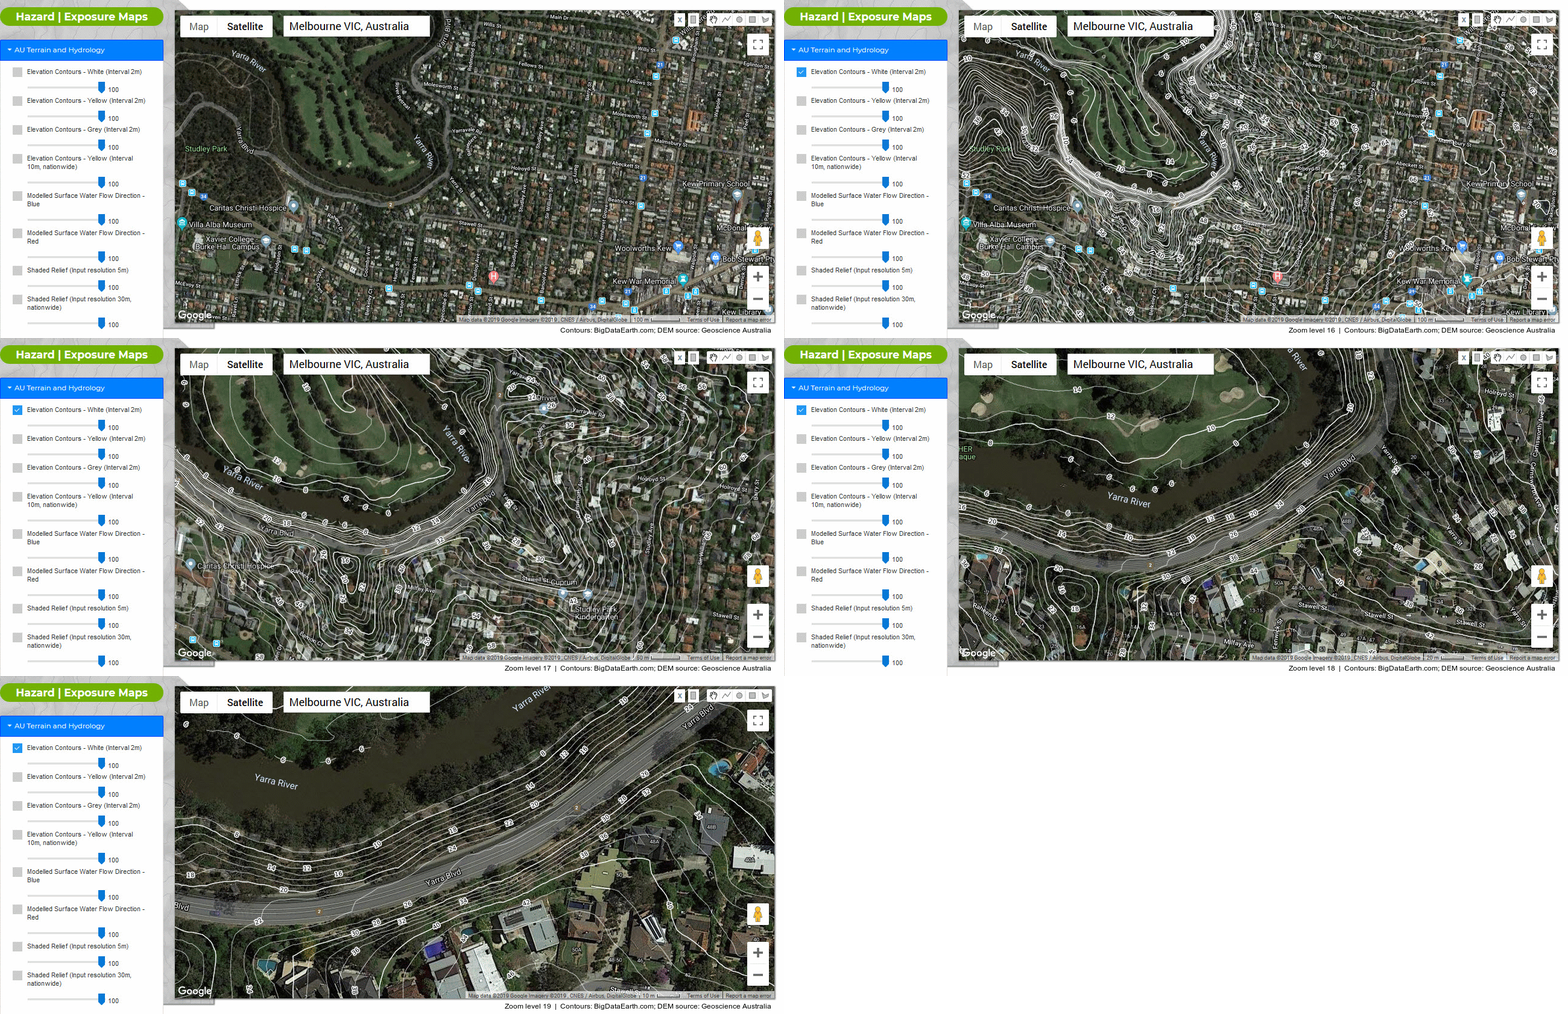
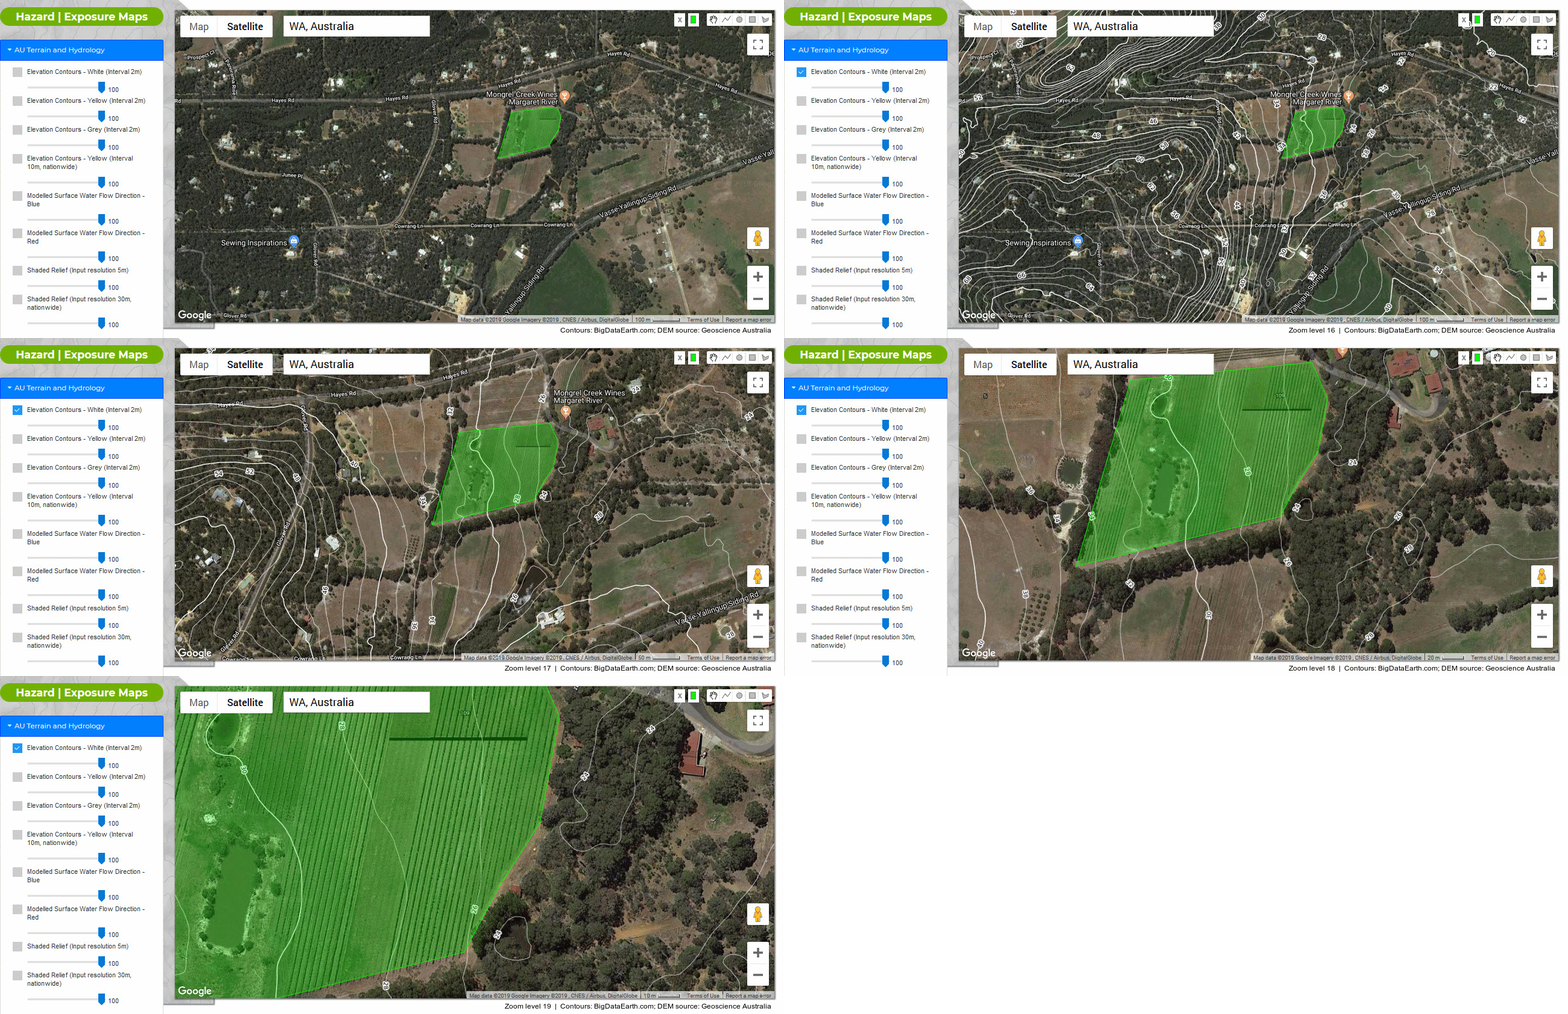
The following suburbs from four states are selected, and respective results are shown in Figures 1-4 (click each figure for a full-resolution version).
-
Manly, New South Wales (urban)
-
Kuraby, Queensland (urban)
-
Kew, Victoria (urban)
-
Yallingup Siding, WA (rural)
Figure 1: Example of the new contour web maps (Manly, NSW; Zoom levels 16-20 displayed)
Figure 2: Example of the new contour web maps (Kuraby, QLD; Zoom levels 15-19 displayed)
Figure 3: Example of the new contour web maps (Kew, VIC; Zoom levels 16-19 displayed)
Figure 4: Example of new contour web maps (Yallingup Siding, WA; Zoom levels 16-19 displayed)


