28 January 2019
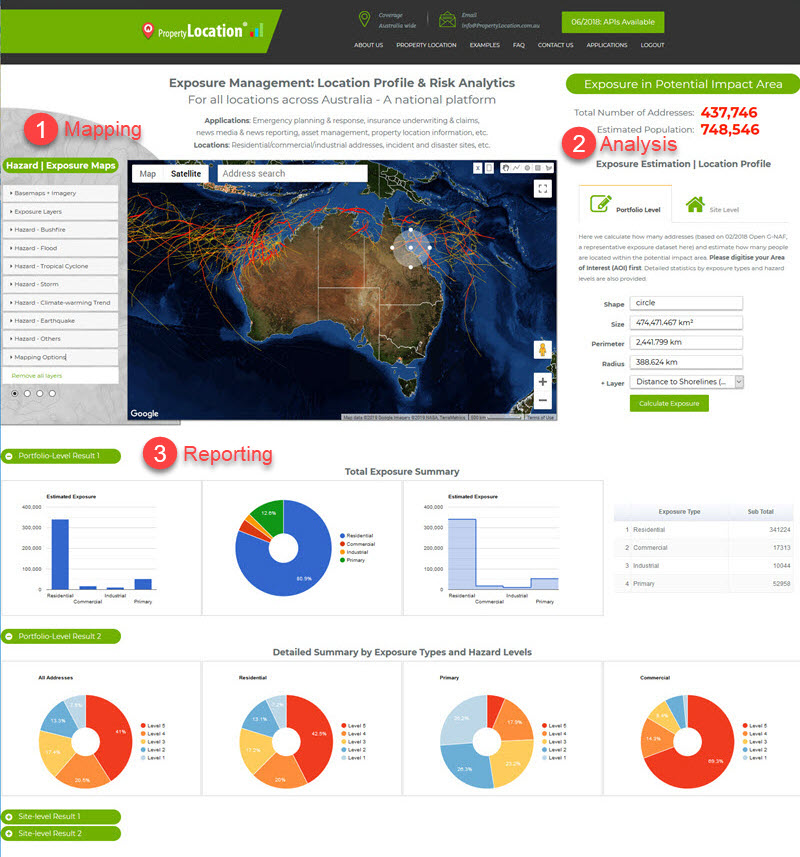
Over the past few years we have been building cloud-based big data and analytics platforms and foundational Location Profile APIs for property location and hazard risk information. These advances have enabled us to speed up the pace of new product development. Now we are pleased to release a new web App on location-centric exposure management specific to emergency and insurance applications. The new App combines web mapping, analysis and reporting altogether.
These days there are many accessible web mapping software and platforms, and existing Apps are often used to catalogue and display geospatial data and maps only. What is lacking most for domain-specific applications (e.g. exposure and risk analytics) is web-based geospatial processing and reporting, and our new App adds substantial functionality to this part.
1. Main Features
1.1 Data – Hazard, Exposure and Risk Layers: For many environmental datasets publicly available (with varying levels of data quality), we apply our domain knowledge and critical evaluation before their adoption. A significant amount of time has been spent modelling and deriving our own unique hazard, exposure and risk datasets (on bushfire, flood, cyclone, etc.) for the web App. Geospatial datasets in compliance with OGC Web Service standards (e.g. WMS and WMTS) and KML can be readily digested. In Australia, we source many public data from the Bureau of Meteorology (BOM), Geoscience Australia (GA) and various state or territory government spatial agencies.
1.2 Mapping: We choose Google Maps APIs to create an essential mapping component, mainly for three reasons: (1) Google Maps platform is powerful, easy to use and the most well known; (2) Street View and many detailed points of interest in Google Maps are very useful for site-level exposure assessment; and (3) External data sources can be efficiently linked and integrated. Besides, we create a full set of digitising, editing and measurement tools for various geometric shapes (e.g. polygon, rectangle, circle and polyline). Any digitised feature shapes are rendered as GIS shapefiles to be processed by the back-end on the cloud, and users have an option to download the shapefiles created.
1.3 Two Levels of Exposure analyses:
-
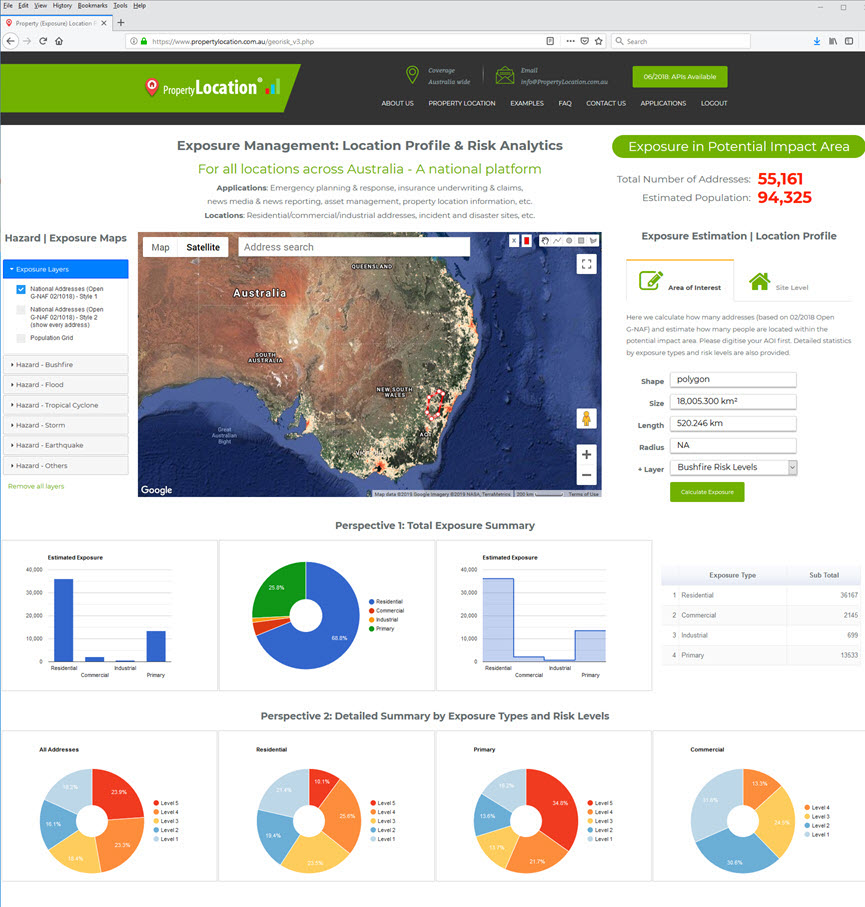
Broad-level (portfolio-level) exposure analysis: For an Area of Interest (AOI), the App can quickly calculate how much the exposure (e.g. the number of addresses, population or sum insured) is located within the potential impact area. Once an AOI is drawn on the map, a user just needs to click a single button to obtain exposure estimates in seconds. If a hazard layer with different risk levels is available, exposure estimates can be further differentiated by exposure types and hazard risk levels (Figures 1 and 2).
-
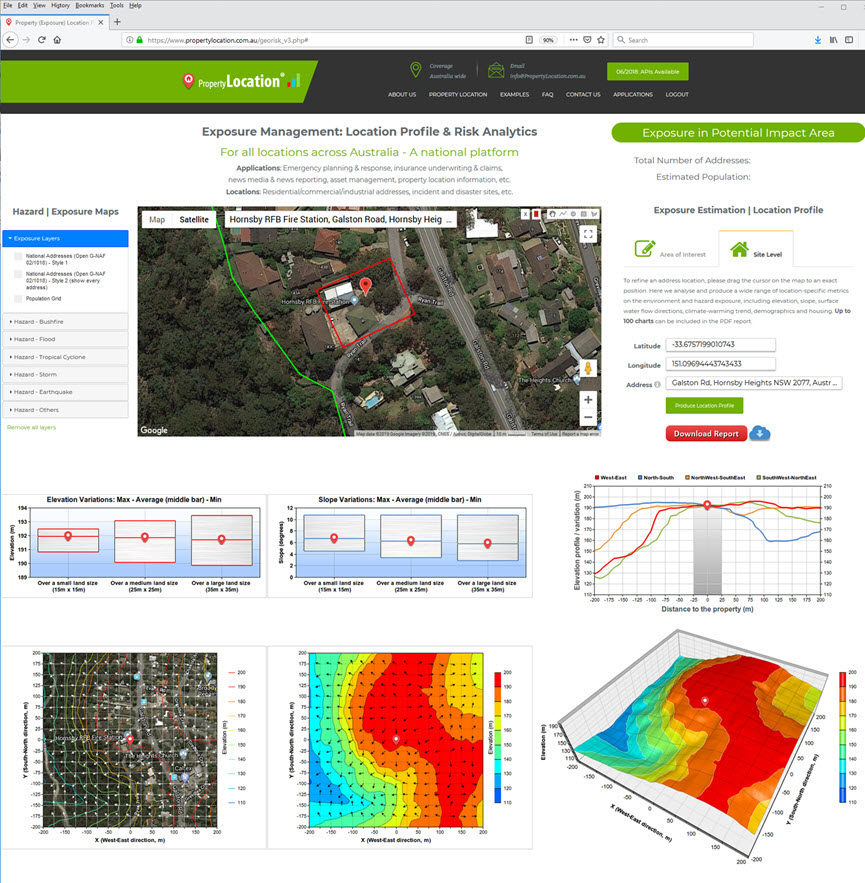
Site-level exposure analysis: For an interested site or address, the new App produces a wide range of location-specific metrics on the environment and hazard exposure, including elevation, slope, surface water flow directions, bushland, climate-warming trend, demographics and housing. Up to 100 metrics, maps and charts are available in seconds (Figure 3). In this regard our unique Location Profile APIs (e.g. bushfire, flood and cyclone) from past significant efforts have made this possible.
1.4 Reporting: At the moment, all results (e.g. metrics, maps and charts) from the site-level exposure analysis are systematically included in a downloadable PDF report (up to 40+ pages). Figures 1 and 2 may be used as data / business intelligence dashboards.

Figure 1: Broad-level exposure analysis for a digitised AOI in the new App

Figure 2: Broad-level exposure analysis for a digitised AOI in the new App

Figure 3: Site-level exposure analysis in the new App (up to 100 metrics, maps and charts are generated)
2. Applications and Licensing
The new web App has been hosted by two big data and analytics platforms:
-
https://PropertyLocation.com.au (for Australia)
-
https://PropertyLocation360.com (for the U.S. and other regions)
Customisation and enhancement of the App is ongoing in response to different geographic coverage, new datasets, client’s requirements and tailored analyses.
Taking the January 2019 bushfires in Tasmania’s Central Plateau as an example, we used the new App to quickly produce some broad- and site-level exposure estimates:
#Bushfires near #Miena #Tasmania captured by #Sentinel2 imagery on 2019-01-23
1. New Web APP taking imagery for bushfire risk analysis
2. Imagery enriched with the NASA MODIS active fire data
3. Detailed site-level location profile report#heatwaves @TasFireService@CopernicusEU pic.twitter.com/ZGEaHNOoJD— BigData Earth (@BigDataEarth) January 25, 2019
Meanwhile, as the underlying cloud-based mapping, analysis and reporting is generic it will be efficient to extend the same technologies to new applications other than exposure management.
If you are interested in a live demo, developing similar web Apps for your application fields, or licensing the App and platforms, please stay in touch.
