11 February 2019
We have been active in reporting and sharing information about the major flooding in Queensland (link to Twitter posts and mass media mentions, e.g. CNN and The Guardian). This brief blog is specific to the flooding in West and North-West Queensland.
First, the big picture. We use NASA’s Terra/MODIS imagery (2019-01-02 vs. 2019-02-10) to see a dramatic transformation of the land before and after the major flooding. An area of about 100,000 sq. km is marked with clear signs of flooding or inundation.
A dramatic transformation of the land before and after the major #flooding in #Queensland
Image source: Terra/MODIS, Corrected Reflectance (Bands 7-2-1, 2019-01-02 vs. 2019-02-10), NASA WorldView @NASAEarthData#floods @QldFES @BOM_Qld @abcbrisbane @ABCRural pic.twitter.com/WzCQ8qPyMp
— BigData Earth (@BigDataEarth) February 11, 2019
We then take imagery in a web App for rapid exposure analysis:
-
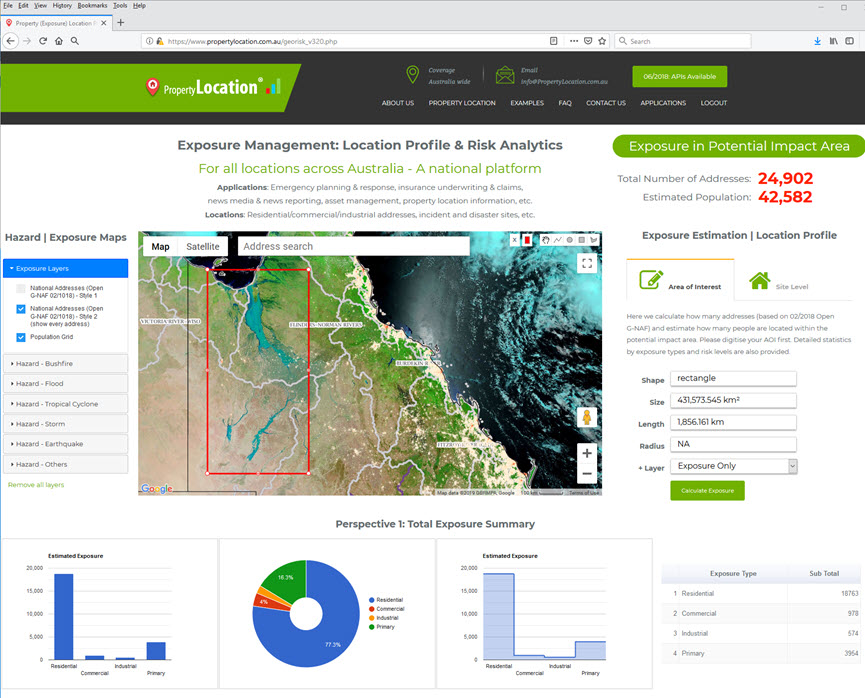
As we all know, West & North-West Queensland is sparsely populated. For an area of 430,000 sq. km (about twice the size of Victoria or half the size of NSW) we drew on the map, the total number of addresses is only about 25,000 (Figure 1). Apart from residential addresses, the remaining majority is related to primary production. Open G-NAF (02/2018 version) is used for this estimation.
-
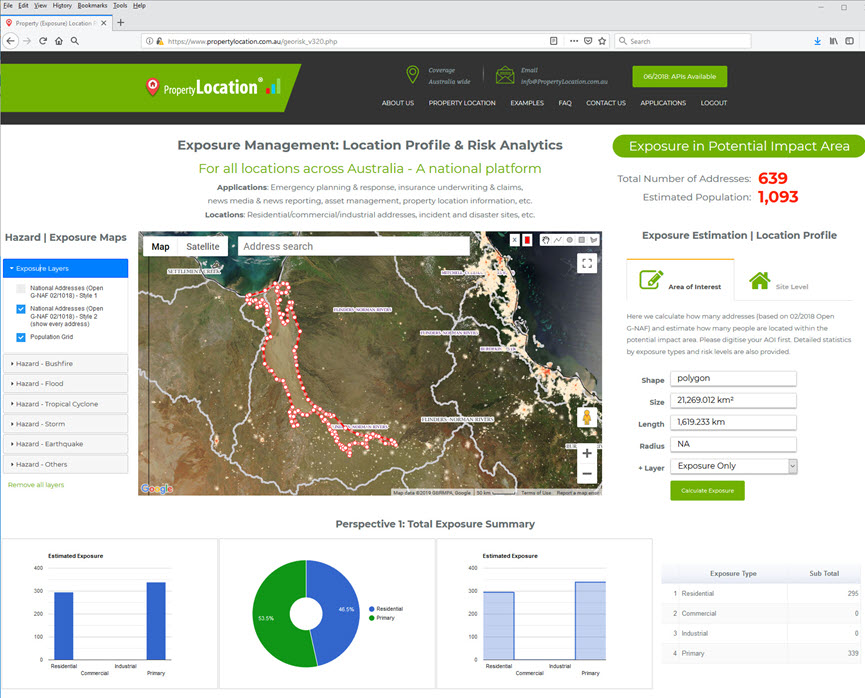
In the large Flinders-Norman Rivers catchment, a big lake (showing continuous flood waters), with the size of at least 21,000 sq. km, has been formed. More than 600 addresses may still have been submerged within (Figure 2). Here Terra/MODIS imagery (2019-02-10, natural colour) and BOM’s river basin boundaries are shown and integrated.
-
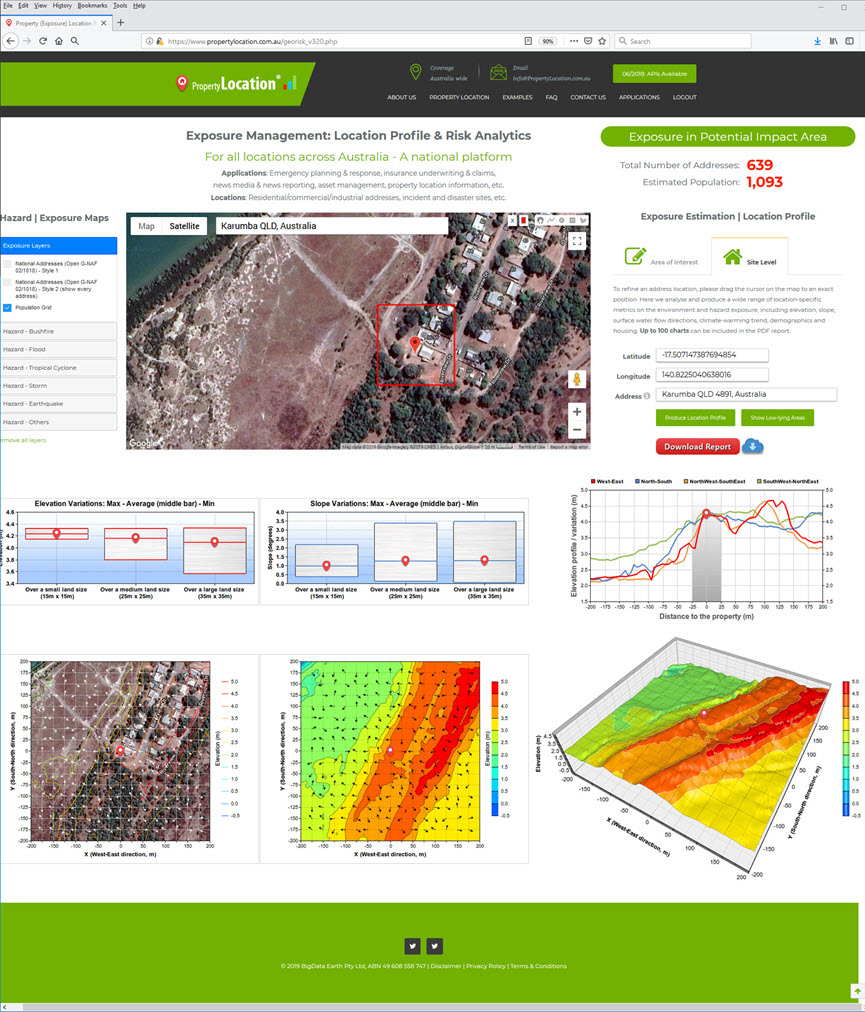
Move from the broad-level (portfolio-level) exposure estimation to site level: For any interested address in the flood-prone area, a detailed location profile report can be automatically generated by including a wide range of contextual location metrics, e.g. a report for an address in Karumba, QLD 4891 (Figure 3). GA’s ELVIS elevation data is analysed to produce relevant terrain metrics.
For impacts on major roads and coastal waters, examples are shown on Twitter posts. If you are interested in similar analytics, please stay in touch.

Figure 1: Broad-level exposure estimation for West and North-West Queensland.

Figure 2: Broad-level exposure estimation for the large flood area in the Flinders-Norman Rivers catchment.

