Earth Observation, Image Processing and Feature Extraction
A vast amount of digital satellite and aerial imagery is being acquired by modern Earth Observation sensors every day. The real challenge is to analyse the raw imagery quickly, extract useful, actionable information with higher accuracy, and apply it in real-world decision making and problem solving.
While there seems no short of image processing techniques and promises, conventional paradigms need to be critically reviewed and a mere data-driven approach is not enough. Image understanding in relation to features of interest is important. We develop accessible image analysis software tools and batch processing workflows, and make a contribution to this direction. Our latest effort is to develop dedicated software tools to rapidly process daily fresh satellite imagery (including Copernicus/ESA Sentinel-2, NASA/USGS Landsat-8, JMA Himawari 8/9 and NOAA GOES 16/17), and apply new artificial intelligence and deep learning techniques for image feature extraction.
High-resolution Digital Imagery Meets Artificial Intelligence
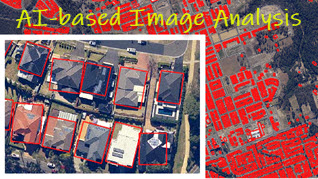
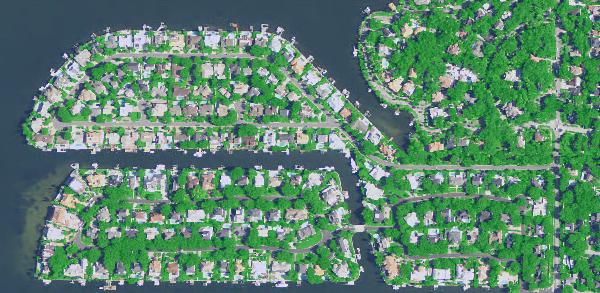
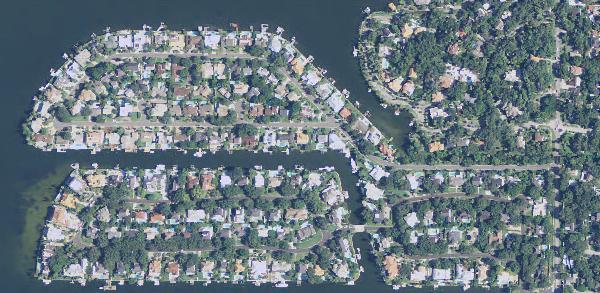
New advances in artificial intelligence and machine learning, especially deep learning neural networks, enable us to extract features from high-resolution satellite and aerial imagery more reliably and quickly. We apply new techniques, inject our understanding about image objects and incorporate contextual geospatial layers to classify image features with high accuracy (e.g. at 90-95%). Many factors are at play and we make our best efforts to probe deeper to achieve even better results. High-performance computing from GCP, AWS or Azure has been extensively used. Outputs are usually in GIS vector forms.
Extracted vegetation highlighted in green. (For more info, please refer to our previous project on the U.S. high-resolution vegetation mapping, link)
Spectral Exploration, Transformation and Discovery
We develop image spectral analysis tools to rapidly process the latest popular satellite images, including those from polar-orbiting satellites (e.g. Sentinel-2 & Landsat-8) and geostationary satellites (e.g. Himawari 8/9 & GOES 16/17).
The new software Spectral Discovery provides accessible and highly efficient tools for (1) rapid band combinations, (2) adaptive image stretching, (3) advanced image pan-sharpening and (4) exploratory image feature extraction. It has been increasingly used by geospatial professionals, environmental scientists and the general public worldwide.
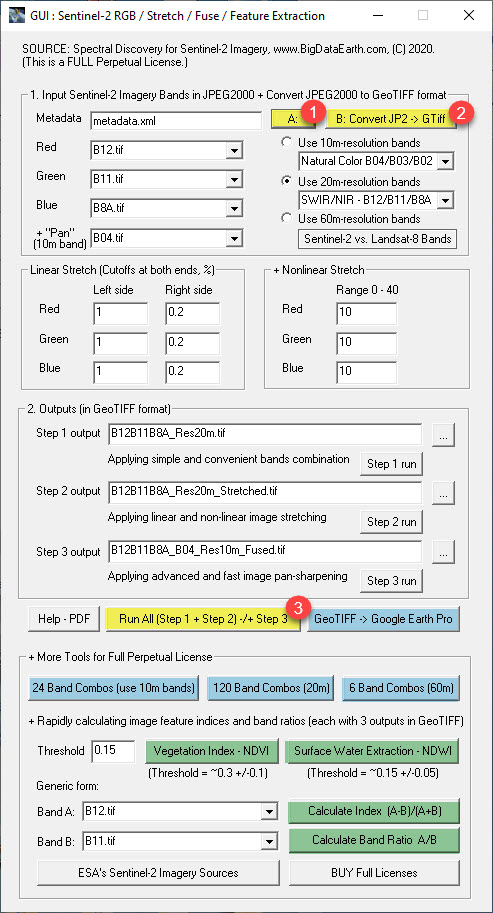
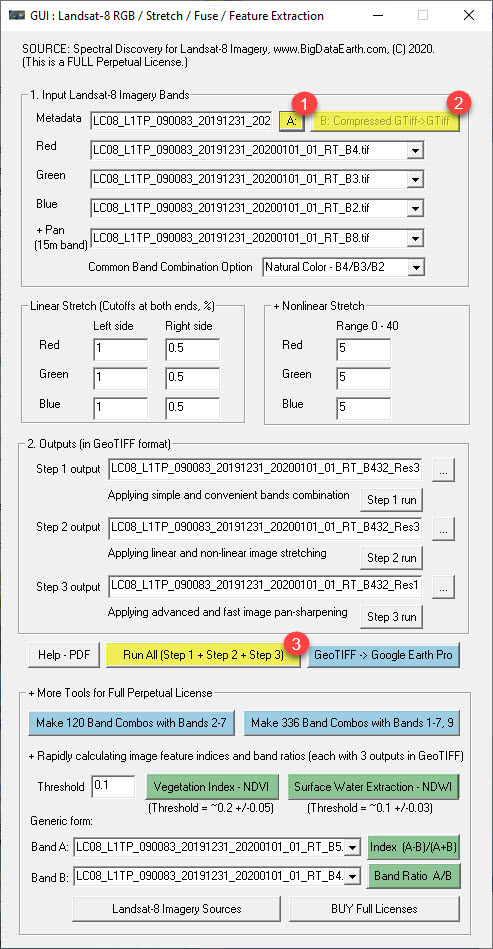
Spectral Discovery software GUI (Version 03/2020). Applications of the software for monitoring major events around the world: 10+ examples – link to a previous blog.
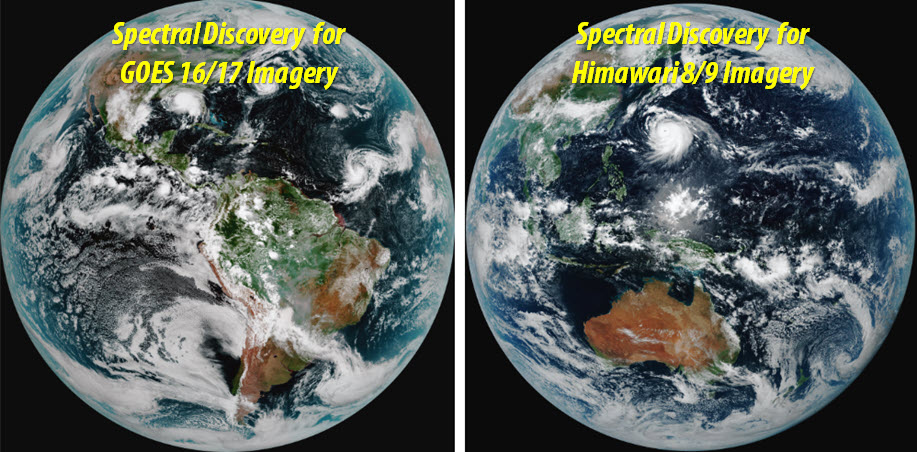
Spectral Discovery software has been used to process near real-time Himawari 8/9 and GOES 16/17 imagery. In addition, we prepare and distribute related composite images in XYZ tiles very efficiently (e.g. available every 10 minutes). Access URLs are in the following forms:
curl https://api.BigDataEarth.com/goes16/{year}/{month}/{day}/{hhmm}/{tileset}/{z}/{x}/{y}.[jpg | png] -H apikey=[x]
or, with a single URL address:
https://api.BigDataEarth.com/h8/{year}/{month}/{day}/{hhmm}/{tileset}/{z}/{x}/{y}.[jpg | png]?&apikey=[x]
Tile maps can be easily integrated with web or mobile mapping applications (those using Google Maps APIs, Leaflet APIs, OpenLayers APIs, Mapbox APIs, etc.), by updating related URLs.
Two examples at specific timestamps: (1) GOES-16 full-disk imagery link; and (2) Himawari-8 full-disk imagery link. In the example, web map zoom levels 2-3-4-5 are used; we can extend zoom levels to 6-7-8 if needed (corresponding to ~2.4-1.2-0.6 km spatial resolutions on the ground, respectively).
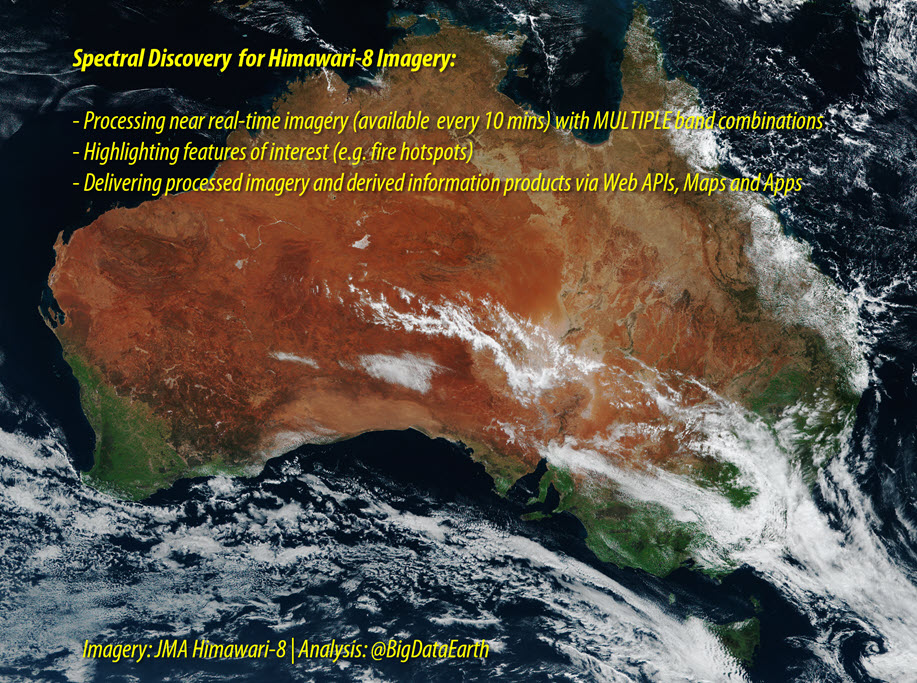
Spectral Discovery software has been used to process near real-time Himawari 8/9 and GOES 16/17 imagery. This is closely related to two of our other main projects: (1) Using fresh satellite imagery to record major events for the news media and the general public link; and (2) Using Himawari-8 imagery to map major bushfires in Australia and developing web apps for rapid hazard and risk analysis link.
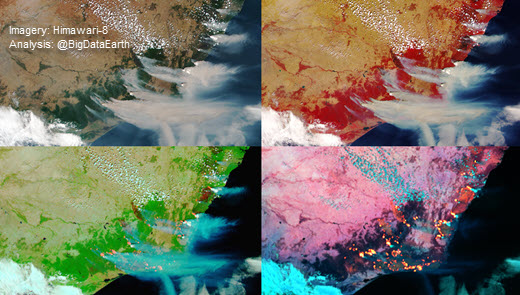
Analysing multispectral satellite imagery to highlight different features of interest (e.g. vegetation, fire scar and hotspots)
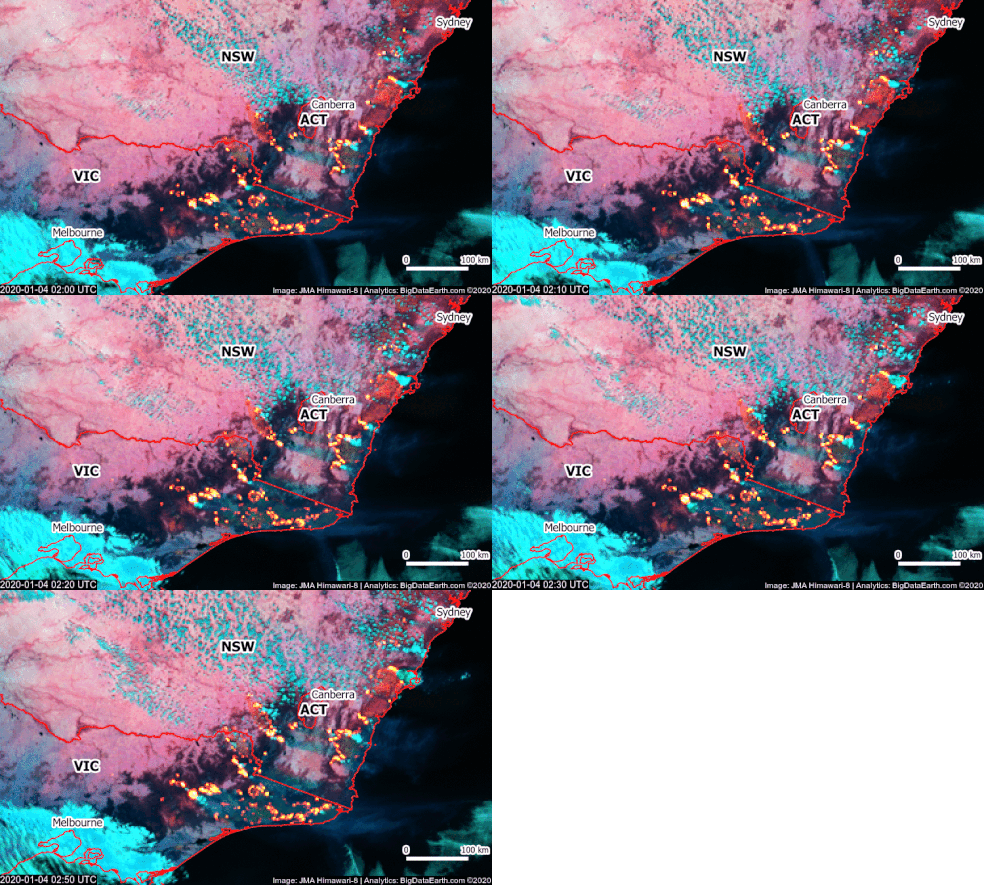
Animation to show rapid fire movement in SE Australia during the 2019-20 Black Summer bushfires
See Features of Interest: From Pixels to Information
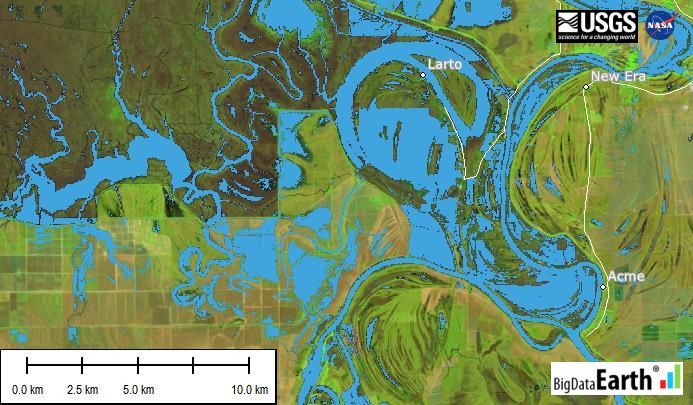
We constantly ask the following important questions in image analysis: (1) What are the Features of Interest (FOI) over pixels? (2) How can they be effectively extracted from pixels in an automated digital workflow? (3) Is the classification accuracy acceptable for the applications at hand? (4) Are there any cost-effective alternatives to achieve the same objective? …
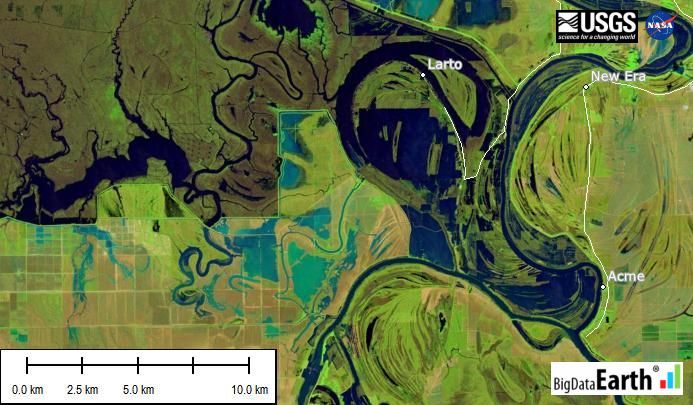
The March 2016 flooding in the U.S. South captured by Landsat-8 imagery. An example of automated classification of surface water areas (in light blue). LANDSAT_SCENE_ID = “LC80230382016080LGN00”; DATE_ACQUIRED = 2016-03-20. Link to previous blog.
See the Invisible: Applications of Short-wave & Thermal Infrared Bands
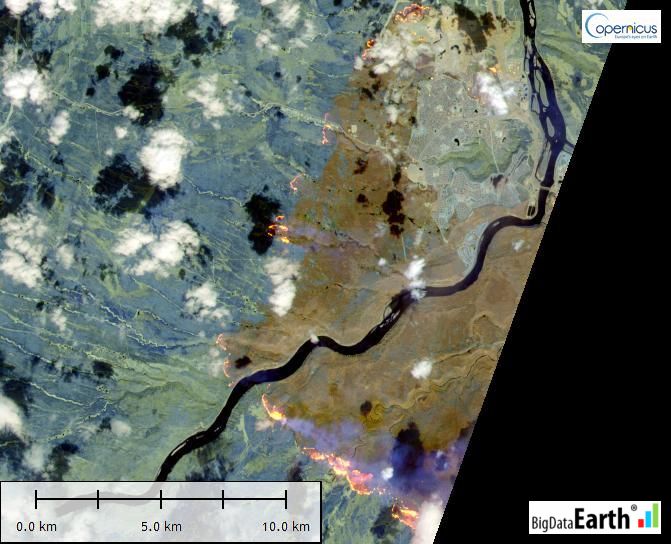
Short-wave infrared (SWIR) and thermal infrared (TIR) bands from the latest high-, medium- and low-resolution satellites are capable of detecting many unique surface features invisible to human eyes and dynamic phenomena through heavy smoke.
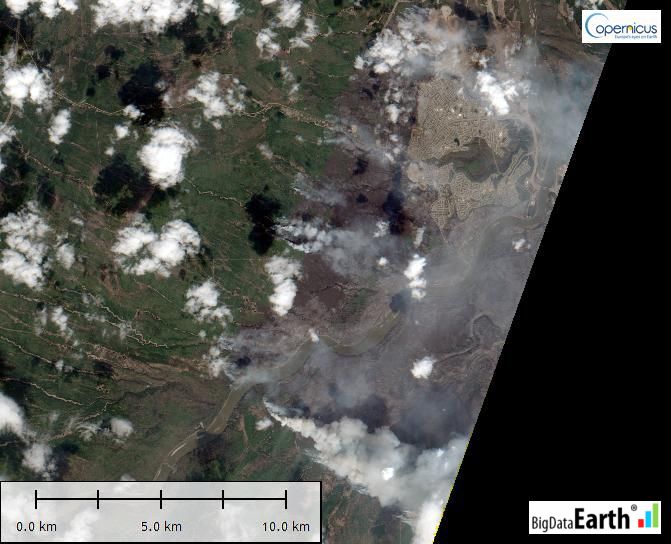
The May 2016 Fort McMurray Fire (Alberta, Canada) captured by the latest Sentinel-2 satellite imagery. Left: Natural colour imagery showing full smoke; Right: False-colour SWIR imagery. Data tile ID: 12/V/VH; Date: 201605-05. Link to previous blog.
See the Detail: Advanced Image Fusion
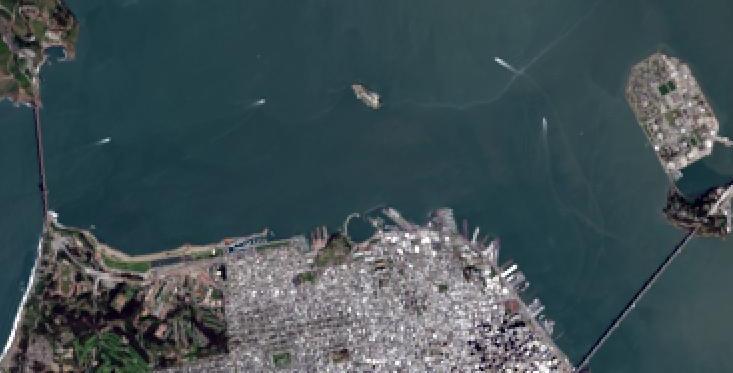
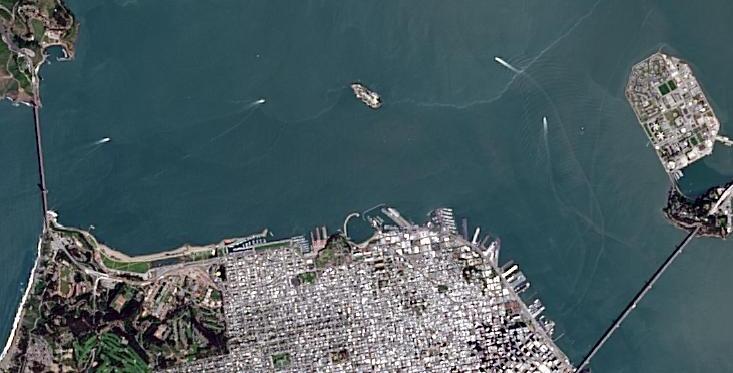
After combining the spectral signatures of the multispectral input and the spatial sharpness of the panchromatic input, the best attributes of both inputs, the output imagery greatly assists image interpretation and visualisation.
Pan-sharpening of Landsat-8 imagery from coarse 30m-resolution (Left) to very sharp 15m-resolution (Right). Location: San Francisco; Image source: Landsat-8; LANDSAT_SCENE_ID = “LC80440342013106LGN00”; DATE_ACQUIRED = 2013-04-16. Images were processed by BigData Earth.

