Modern Earth Observation satellites are often equipped with special sensors that are capable of measuring the reflectance of ground features at short-wave infrared (SWIR) wavelengths. Most SWIR images currently in use are from the following four major satellites:
-
Sentinel-2 (ESA, 20m resolution for SWIR bands)
-
Landsat-8 and Landsat-7 (NASA & USGS, 30m resolution for SWIR bands)
-
ASTER (Japan METI/JSS & NASA, 30m resolution for SWIR bands)
-
WorldView-3 (DigitalGlobe, 3.7m resolution for SWIR bands)
Data from Sentinel-2, Landsat and ASTER are openly available. Typical environmental applications of SWIR imagery include:
-
Classifying different types of rocks for mineral mapping
-
Seeing through airborne particles such as smoke, fog, smog, haze, steam and dust in natural hazards (e.g. wildfires and volcanic eruptions)
-
Monitoring water content of ground features (e.g. soil, vegetation and surface water)
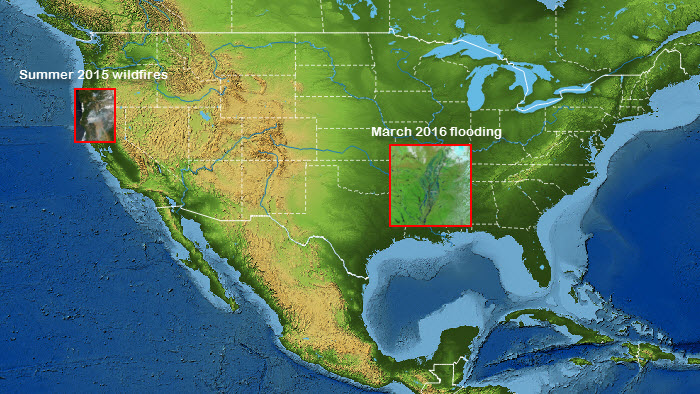
We develop software tools to rapidly make SWIR composite imagery (containing at least one SWIR band) in vivid colours. In this post, we illustrate the capability of Landsat-8 SWIR imagery for (1) detecting hot spots of active wildfires, and (2) classifying surface water extent during flooding. Two recent natural hazards from the U.S. (the summer 2015 wildfires in the West and the March 2016 flooding in the South) are taken for case studies. (We plan to make a separate post covering the use of SWIR imagery for mineral mapping in the future.)
1 – The summer 2015 wildfires in the U.S. West
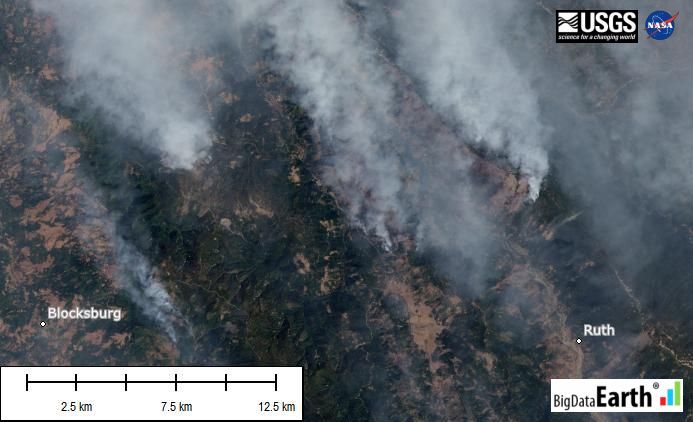
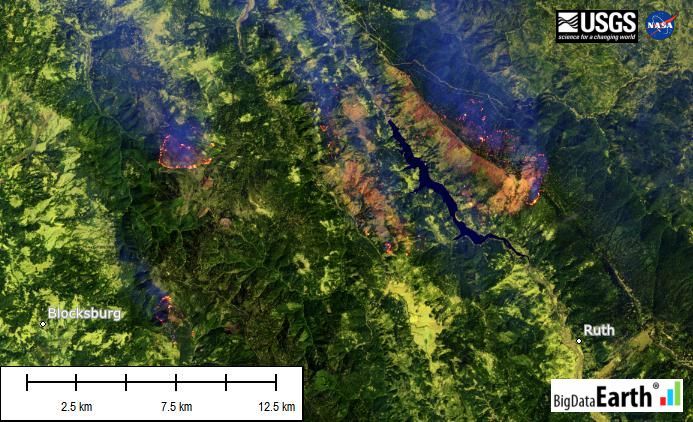
The summer 2015 wildfires in the West were among the worst in the U.S. history. In California alone, an insurance loss of more than $1 billion was recorded (link). The MODIS imagery at 250m resolution from the NASA Earth Observatory (link) provided an excellent overview of the large scale of the event. Medium-resolution imagery (e.g. Landsat-8), with sufficient spatial and spectral details, is perfectly complementary to the low- or high-resolution imaging and best suited for mapping fire scars and fire hot spots. Figure 1 shows that the processed Landsat-8 SWIR imagery, as opposed to the natural colour imagery, clearly sees through thick smoke and locates fire hot spots. So let’s see the invisible with the SWIR imagery!
Figure 1: The Summer 2015 wildfires in the U.S. West. Left: Natural colour imagery; Right: SWIR composite imagery. LANDSAT_SCENE_ID = “LC80450322015215LGN00”, DATE_ACQUIRED = 2015-08-03.
2 – The March 2016 flooding in the U.S. South
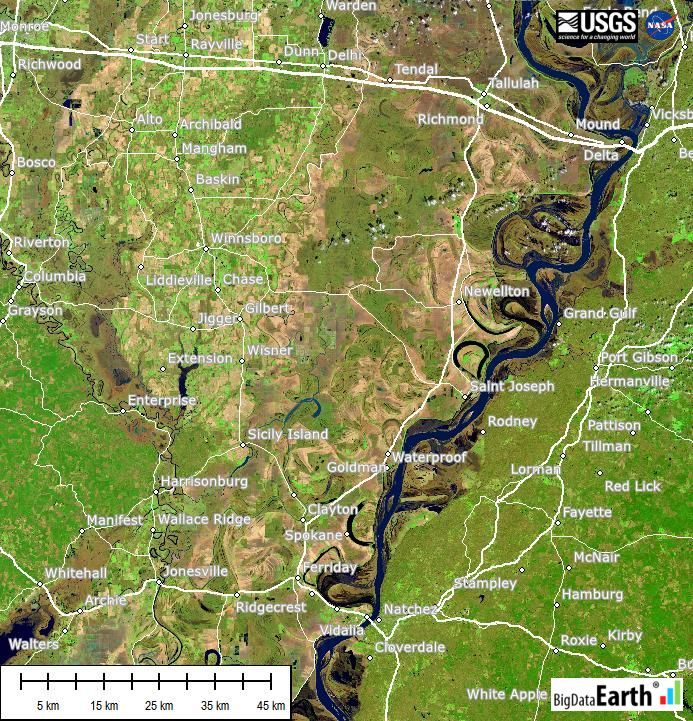
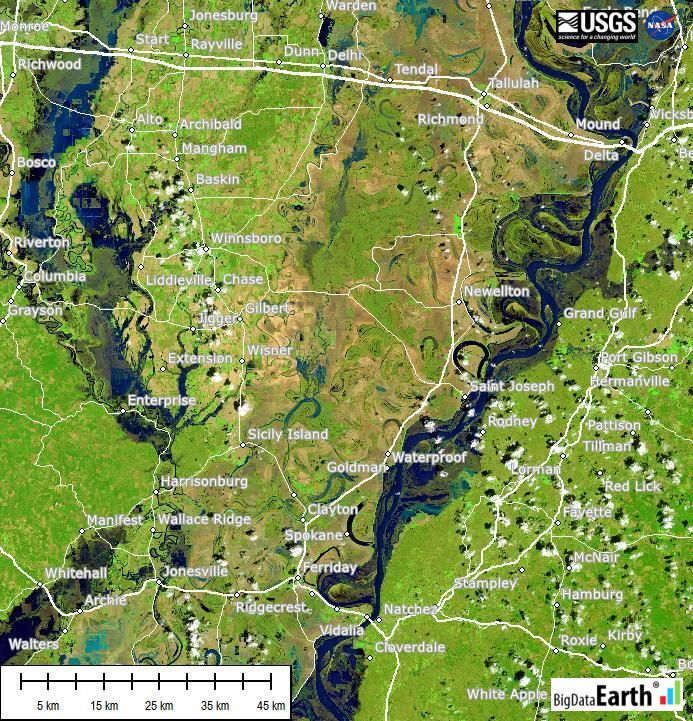
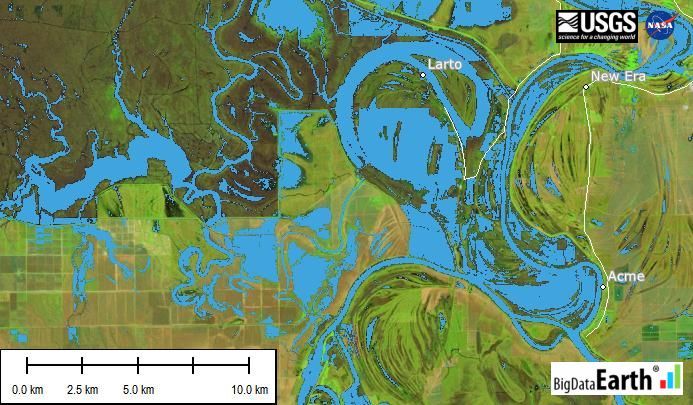
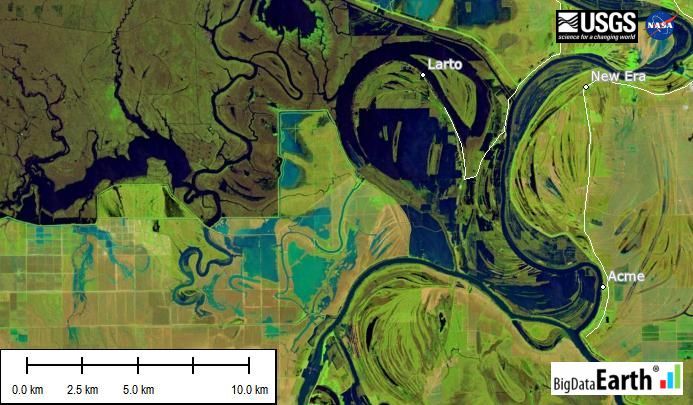
The daily MODIS imagery (link) once again captured the magnitude of this region-wide event. For details, we resort to the medium-resolution Landsat-8 imagery. Figure 2 shows the Ouachita River – Mississippi River area across the Louisiana and Mississippi border soon before and after the event. Expanded surface water during flooding is clearly shown by the SWIR composite imagery (in light and dark blue colours, Figure 2), while in natural colour imagery (not shown) muddy water can hardly be distinguished from nearby brown bare soils and agricultural land.
Figure 2: The March 2016 flooding in the U.S. South. Image location: Ouachita River – Mississippi River area across the Louisiana and Mississippi border. Landsat-8 SWIR composite images. Before flood: LANDSAT_SCENE_ID = “LC80230382016064LGN00”; DATE_ACQUIRED = 2016-03-04. After flood: LANDSAT_SCENE_ID = “LC80230382016080LGN00”; DATE_ACQUIRED = 2016-03-20.
Apart from better visualisation and interpretation of surface water areas in the SWIR composite imagery, the use of SWIR data can greatly assist the classification of surface water extent. This is even more important from an analytical perspective. Figure 3 shows such water features (in light blue) automatically delineated from the SWIR composite imagery.
Figure 3: Automated classification of surface water areas with a very high accuracy. Event: The March 2016 flooding in the U.S. South. After flood SWIR composite imagery: LANDSAT_SCENE_ID = “LC80230382016080LGN00”; DATE_ACQUIRED = 2016-03-20.

