8 March 2016
(We thank the Australian Broadcasting Corporation – ABC – for promoting this for the general public. Twitter, ABC website)
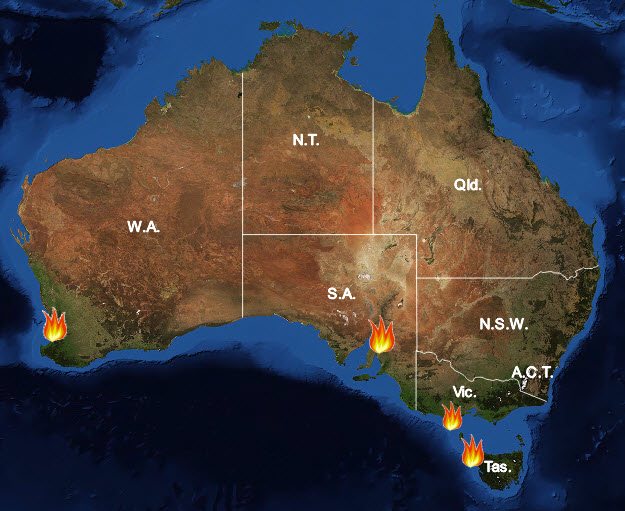
Extreme temperatures, frequent heatwaves and prolonged drought (link), enhanced by one of the most powerful El Niño events, have once again caused many bushfires in Australia in 2015-2016 summer season. Major damaging bushfires (grass fires and forest fires) broke out in most bushfire-prone states, including:
-
The November 2015 Pinery bushfires in South Australia
-
The December 2015 Great Ocean Road bushfires in Victoria
-
The January 2016 Yarloop bushfires in Western Australia
-
The January 2016 bushfires in Tasmania

These major fires not only destroyed important infrastructures and hundreds of residential, commercial and agricultural buildings, but also burned hundreds of thousands of acres of vegetation. As of late February 2016, an insurance loss of about $400 million was reported for the three major fires in South Australia, Victoria and Western Australia (link). The January 2016 fires in North West Tasmania burned ecologically-significant ancient forests in parts of the Tasmanian Wilderness World Heritage Area, as the state of Tasmania experienced the warmest summer on record (link). This prompted some useful discussions over the potential link between abnormal fire occurrences and human-induced global warming (link 1, link 2).
Earth Observation has become an increasingly important tool to monitor and map major hazardous events. Medium-resolution Landsat-8 satellite imagery, openly available via the NASA and USGS’s Landsat program, is an excellent data source to reveal the full extent of these fires (fire scars). It is benefited from some of the key features of the Landsat-8 satellite imagery, including medium spatial resolutions (15m and 30m), very large swath width (the strip of the Earth’s surface captured by each satellite scene) and multispectral bands. The recent generation of high-resolution satellite or aerial imagery just cannot provide the big picture of such phenomena efficiently at this scale.
In what follows we show a series of high-quality Landsat-8 images soon after and before each of the four major bushfires.
Figure 1: The November 2015 Pinery bushfires in South Australia. After fire: LANDSAT_SCENE_ID = “LC80970842015356LGN00”; DATE_ACQUIRED = 2015-12-22. Before fire: LANDSAT_SCENE_ID = “LC80970842015276LGN00”; DATE_ACQUIRED = 2015-10-03.
Figure 2: The December 2015 Great Ocean Road bushfires in Victoria. After fire: LANDSAT_SCENE_ID = “LC80930872016011LGN00”; DATE_ACQUIRED = 2016-01-11. Before fire: LANDSAT_SCENE_ID = “LC80930872015344LGN00”; DATE_ACQUIRED = 2015-12-10.
Figure 3: The early January 2016 Yarloop bushfires in Western Australia. After fire: LANDSAT_SCENE_ID = “LC81120832016048LGN00”; DATE_ACQUIRED = 2016-02-17. Before fire: LANDSAT_SCENE_ID = “LC81120832015349LGN00”; DATE_ACQUIRED = 2015-12-15.
Figure 4: The late January 2016 bushfires in North West Tasmania. After fire: LANDSAT_SCENE_ID = “LC80920882016052LGN00”; LANDSAT_SCENE_ID = “LC80920892016052LGN00”; DATE_ACQUIRED = 2016-02-21. Before fire: LANDSAT_SCENE_ID = “LC80920882015353LGN00”; LANDSAT_SCENE_ID = “LC80920892015353LGN00”; DATE_ACQUIRED = 2015-12-19.


