18 June 2019
We keep showcasing the potential application of new high-resolution contour web maps for Australia that have been recently developed (link). Previous blogs in this series include:
-
Applications of New National Contour Web Maps: Part 2 (Identifying Low-lying Coastal Areas) – link
-
Applications of New National Contour Web Maps: Part 1 (Enhancing High-resolution Imagery Mapping) – link
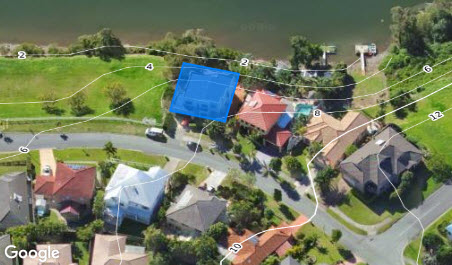
In this blog we illustrate the use of high-resolution contour web maps to identify riverine flood-prone areas. Usual basemaps (e.g. imagery) do not provide this type of information but once superimposed with measured contextual layers such as elevation contours, at-risk areas or exposure prone to flooding can be clearly revealed with little uncertainty. The integrated overlay map is particularly useful and relevant during emergencies when an evacuation order is in place for low-lying areas.
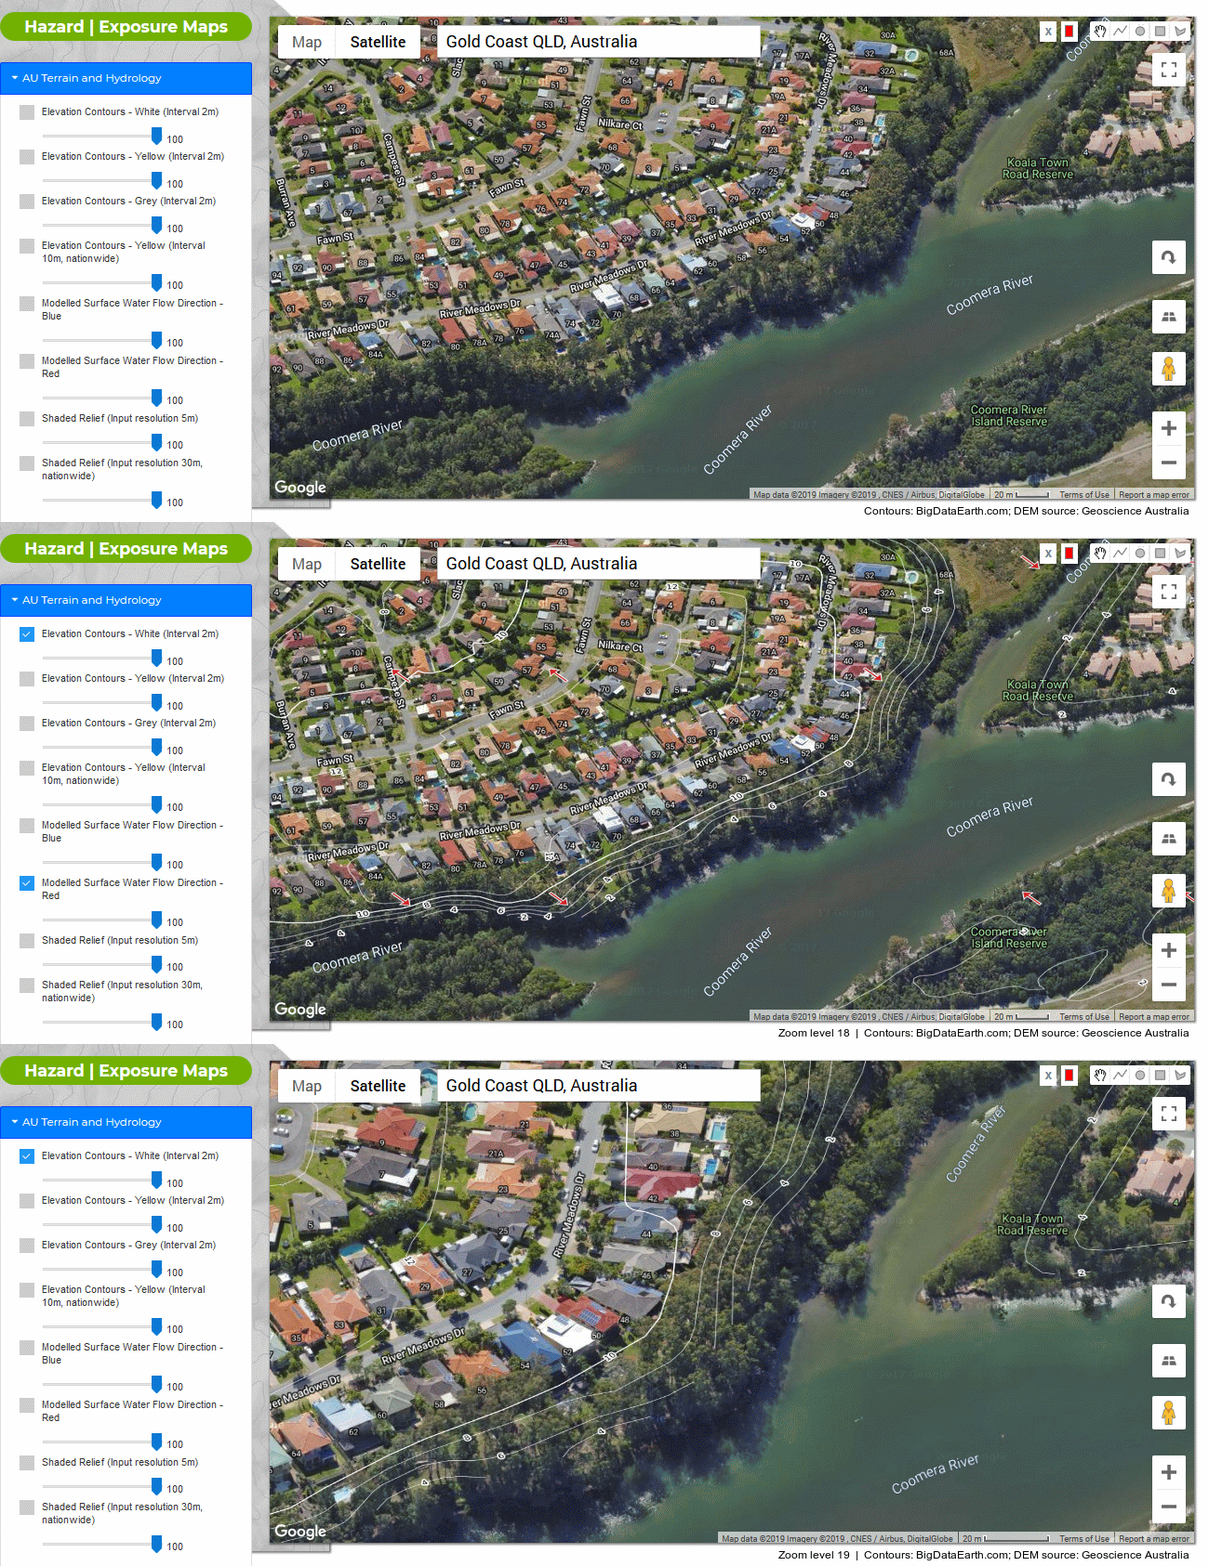
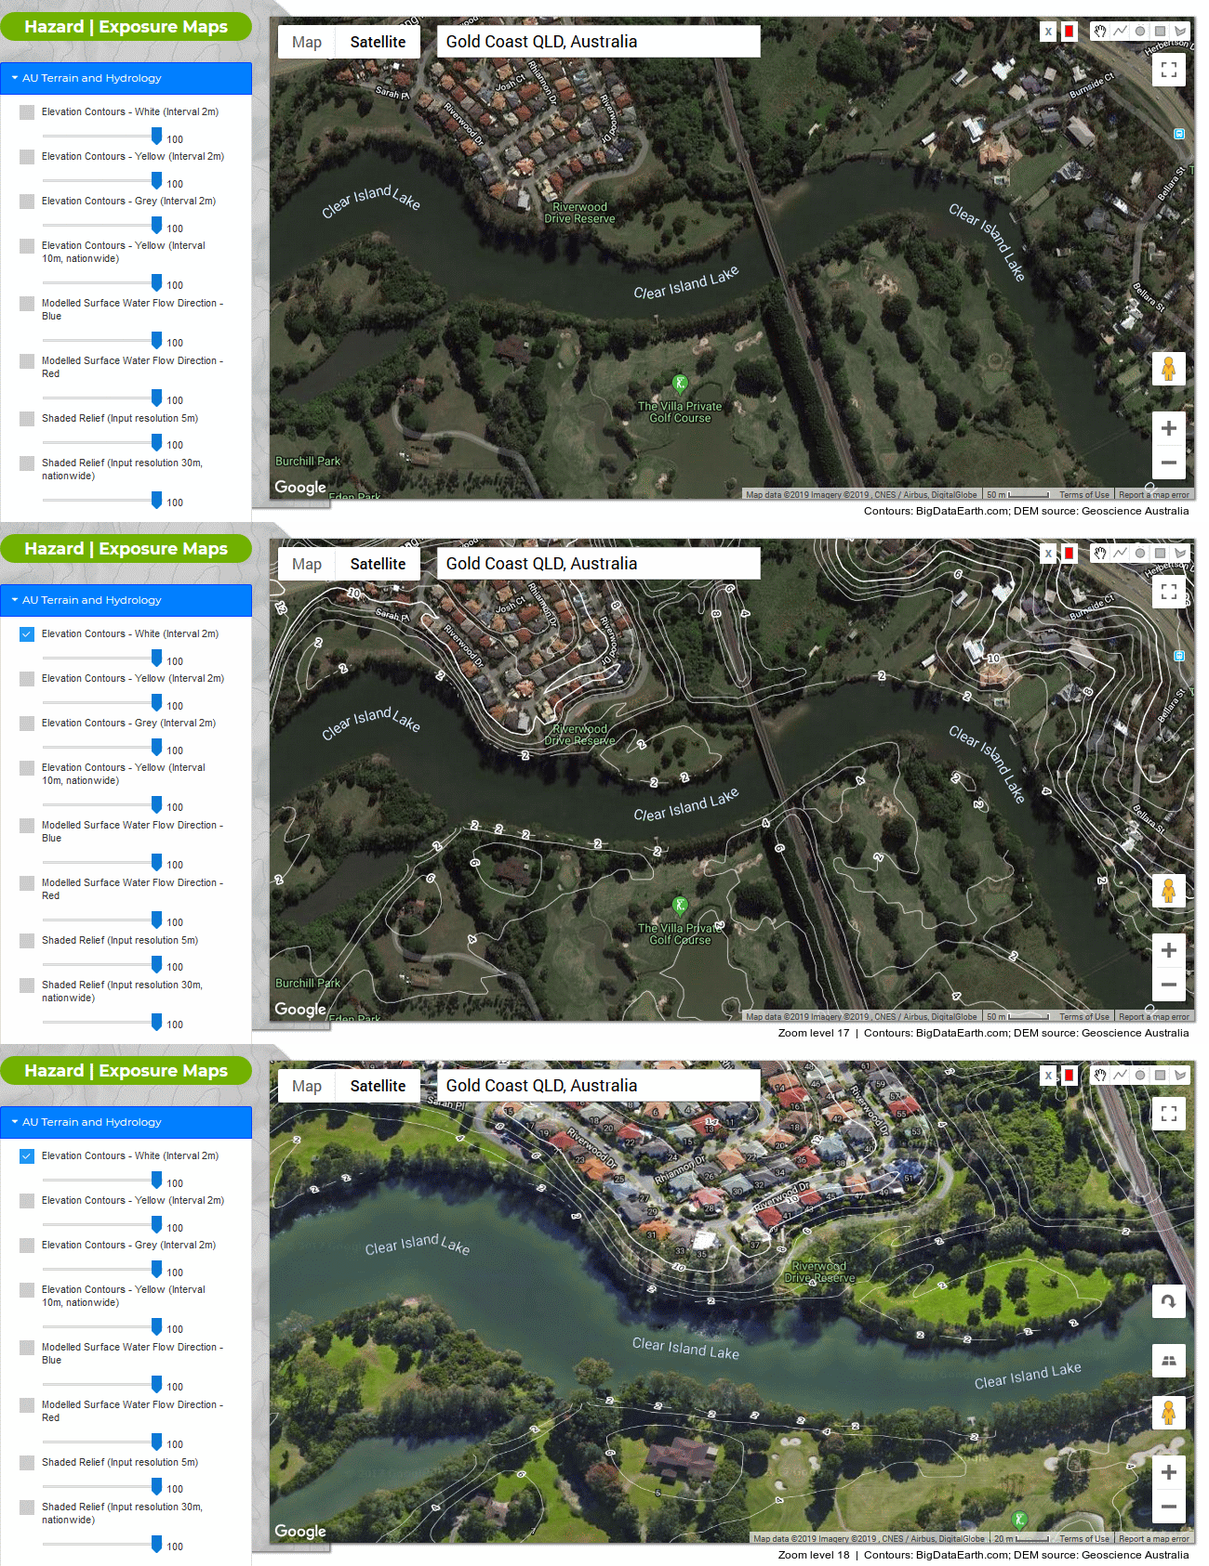
The high-resolution contour maps currently cover ~70% Australian population, and can be accessed by making a link to a URL in desktop and web/mobile mapping. Figures 1 and 2 show two examples of flood-prone areas in southeast Queensland with scalable contour maps added (click each figure for a full-resolution version):
-
Coomera River, Gold Coast, QLD
-
Clear Island Lake, Gold Coast, QLD
If you are after similar maps for your area of interest, please stay in touch.

Figure 1: Example of the new contour web maps (Coomera River, Gold Coast, QLD; Zoom levels 18 and 19 displayed)
Figure 2: Example of the new contour web maps (Clear Island Lake, Gold Coast, QLD; Zoom levels 17 and 18 displayed)


