3. Modern Earth Observation, Image Analysis and Major Events
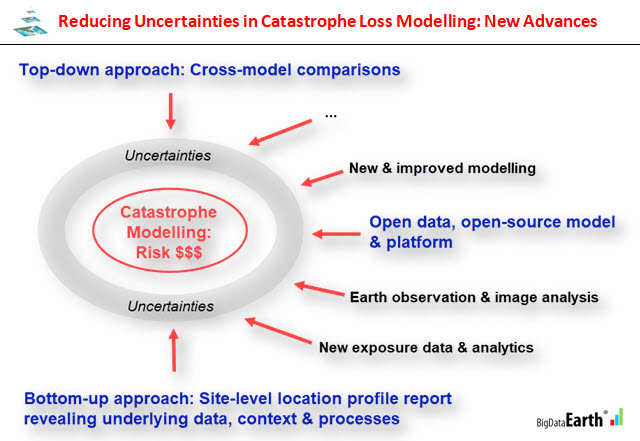
Significant progress has been made in relation to Earth observation data capture, data sharing, processing and applications over the past few years. More and more Earth observation systems provide high-resolution data (e.g. imagery, elevation and LiDAR cloud points), and government agencies (e.g. NASA, ESA and JAXA) release more data openly. Leading cloud services providers take advantage of this and make a vast amount of open data very accessible via cloud, e.g.
-
Earth on AWS (link)
-
Google Earth Engine (GEE, link)
Besides, cloud-based geospatial processing engines (e.g. GEE), with unprecedented capacity and capability, provide new analytical data that many catastrophe models require.
Given an easy access to the new Earth observation data, monitoring and mapping the latest major events for rapid emergency response becomes easier than before. We at BigData Earth have been developing rapid image processing software and made an active contribution in this application field, please see a related blog (“Monitoring Major Events with Global Earth Observation and Geospatial Big Data Analytics: 10+ New Examples”)
4. New Exposure Data and Analytics
Catastrophe loss models that use exposure data based on coarse and artificial areal boundaries (e.g. CRESTA Zones and postcodes) are increasingly scrutinised. This has been one of the largest implementation uncertainties in catastrophe loss modelling as exposure location often does not match with underlying hazard and other data in a spatially explicit manner.
Large-scale, granular exposure datasets specific to the built environment and at a building footprint level are becoming available thanks to modern Earth observation (especially the very high resolution satellite and aerial imagery), new generation of machine learning methods and high-performance computing. Now significantly more accurate exposure estimation in catastrophe loss modelling can be warranted. Such exposure datasets at the national level include:
-
June 2018: Microsoft releases 125 million building footprints in the U.S. as open data (link)
-
October 2018: DigitalGlobe releases 169 million building footprints in the U.S. (link)
-
November 2018: PSMA releases built environment data for 15 million buildings in Australia (link)
5. Bottom-up Approach: Site-level Location Profile Report Revealing Underlying Data, Context and Processes
A common top-down observation has been that even for the same area, same input data source and same type of catastrophe loss models, divergent results are often produced by different vendor models. This demands a deep dive into the input and analysis used in models. A new type of information products with a bottom-up approach is needed to readily examine potential implementation uncertainties.
We have been developing unique hazard and exposure investigation tools (e.g. location profile reports specific to cyclones, floods and forest fires), where a comprehensive set of location-specific metrics on the environment, hazard context and processes are created. Cloud-based, geospatial big data analytics platforms have been developed to enable and automate the delivery of such reports via web APIs. Coverage includes Australia, the contiguous US and other regions.
-
Site-level location profile report for historical tropical cyclones (hurricanes or typhoons, covering North Atlantic, West Pacific and Australia) (link)
-
Site-level location profile report for flood risk analytics (covering Australia and the contiguous U.S.) (link)
-
Site-level location profile report for forest fire risk (bushfire or wildfire, covering Australia and the state of California) (link)
Accessible location profile reports, purposefully containing many visuals such as imagery, maps, charts and animations, can be used to greatly help investigate some key aspects of the catastrophe models and associated implementation uncertainties (e.g. to compare or validate the common input used in models). We see site-level location profile reports should be an essential part of the modelling practice; to have many high-level models alone would not help. They are complementary to each other.
Summary
Catastrophe loss modelling is evolving. New data and information about post-event claims and from multiple scientific disciplines, as well as fresh investigative perspectives, are always needed. It is important to keep an open and critical view in order to reduce model uncertainties and advance the modelling practice.
If you are interested in more presentations and demos on this topic, please stay in touch.
Related
– New R&D in Property Location and Hazard Risk Analytics: A Transformative Journey from Desktop Computing to Cloud Computing link
– Rapid Response to Disasters & Emergencies: Data & Analytics Services link


