3 April 2017
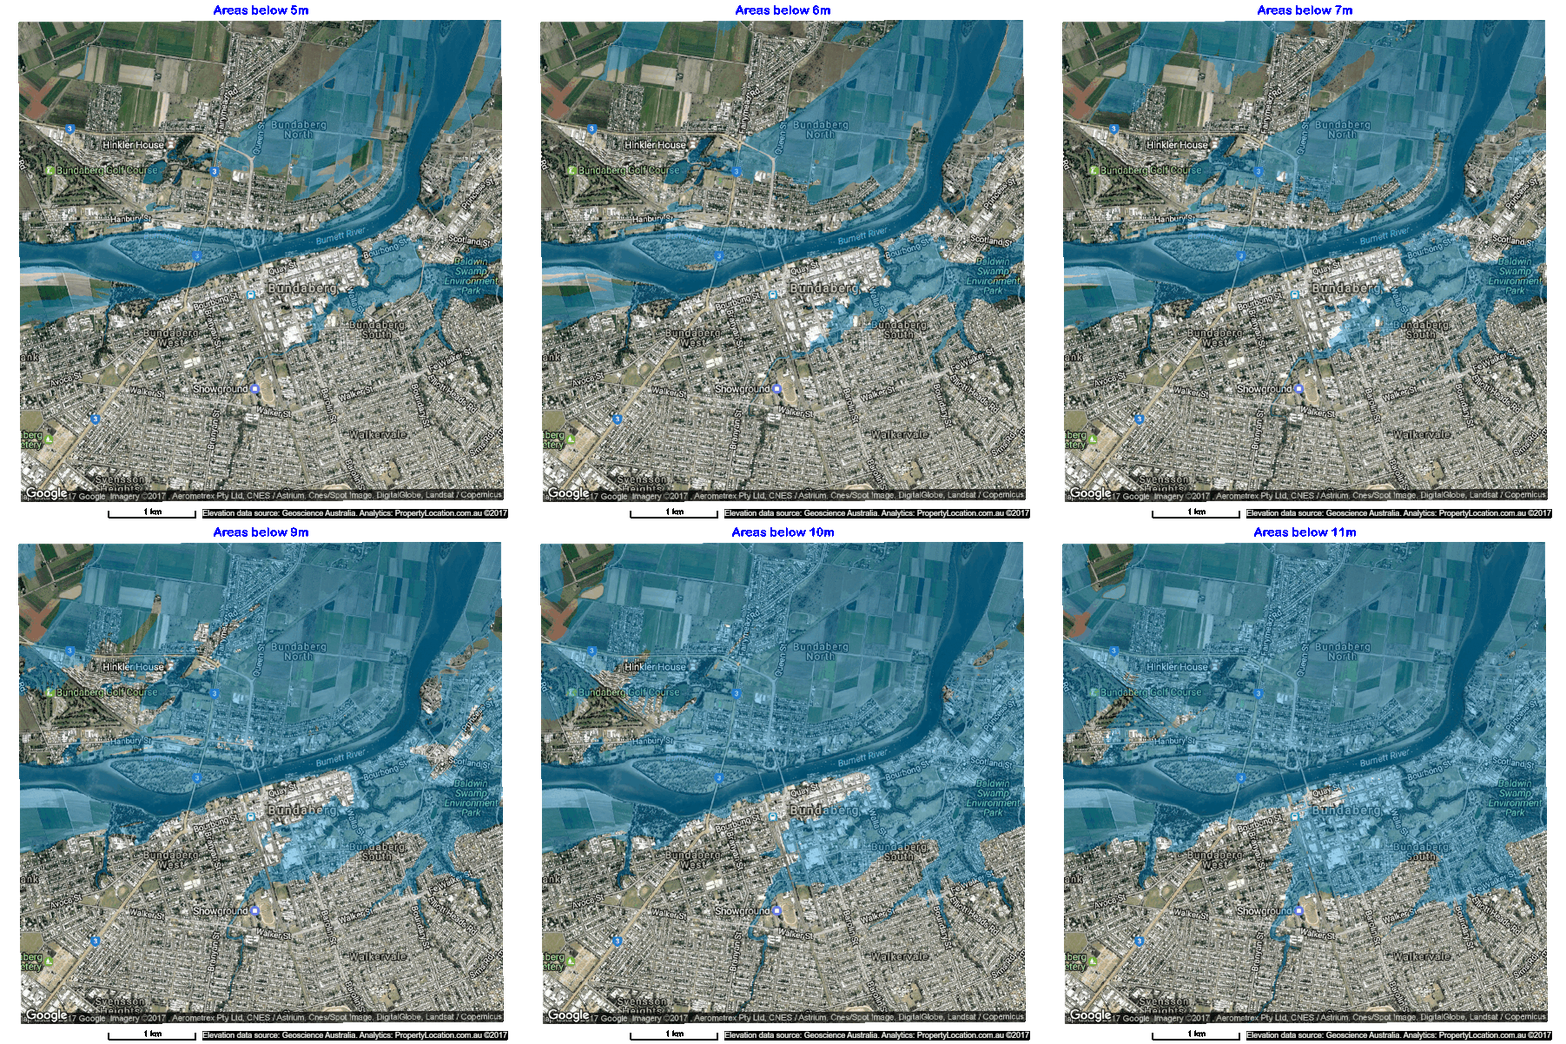
Last Friday we developed two animations that show estimated flood extents of the major floods in Lismore and Murwillumbah, northern NSW. Today we extend that work and apply the same technique to effectively map and visualise many low-lying, flood-prone areas in Queensland. We choose the following two areas for demonstration:
-
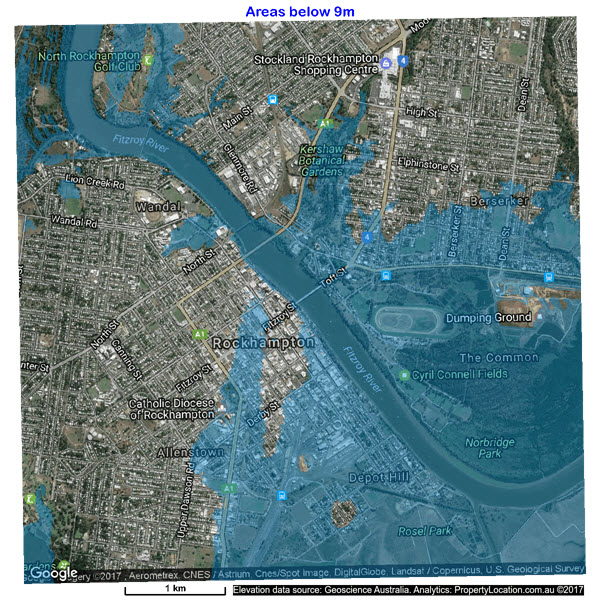
Rockhampton along the Fitzroy River
-
Bundaberg along the Burnett River
In the aftermath of the Tropical Cyclone Debbie that made landfall on the Queensland coast last week and the accompanied heavy rainfall in vast regions, the Australian Government Bureau of Meteorology (BoM) has issued major flood warnings for the Fitzroy River and Rockhampton (the largest city along the river) faces major inundation:
Flood Warning Number 31 Issued at 11:58 am EST on Monday 3 April 2017: A major flood peak of 9.00 metres is likely at Rockhampton during Wednesday. This flood level is just under the 2011 flood peak.
We have used the 5m-resolution, LiDAR-derived DTM from Geoscience Australia’s ELVIS Elevation Information System for mapping the low-lying areas. Note that in this work we do not consider any physical mitigation measures (e.g. barriers and levees) that might affect water flows and levels, but directly focus on underlying DTM.
If you are interested in any particular GIS layers or full-resolution outputs, please let us know. We have been developing desktop- and web-based software tools to deliver similar maps / animations rapidly for any location in Australia and elsewhere.
Figure 1: Low-lying areas along the Fitzroy River at Rockhampton. Click the picture above to see the full-resolution animation, and press F11 function key on the keyboard for full-screen visualisation.


