10 August 2017
In the previous post, we presented the increase of Australian population and residential dwellings from 2006 to 2016, and how they vary across States and Territories. In this post, we report how much and how fast exposure has changed in coastal regions during the same period. (Australia is sometimes seen as the world’s largest island.)
Two key inputs used for the study:
-
The time series profile of exposure (population and private dwellings) at a finer Census geographical level – Statistical Area Level 2 (SA2). The SA2 groups communities with similar social and economic characteristics; within cities, SA2s often represent one or two suburbs. Nationwide, the number of SA2s is similar to that of Postcodes.
-
Various distance ranges from shorelines. It is well known that the definition of coastal region is vague and colloquial. Worldwide, the broad area within 100km of the shoreline is often suggested. Here we discuss the coastal region at two resolutions: 100km and 10km from shorelines. The shorelines are specific to any coastal waters (e.g. rivers and estuaries) connecting to the open sea.
As the ratio of population to private dwellings (i.e. residential dwellings) has been stable for any large regions, to avoid a repeated discussion over the changing pattern or trend, we mainly focus on occupied private dwellings (dwellings, hereinafter).
Broad look at a resolution of 100km
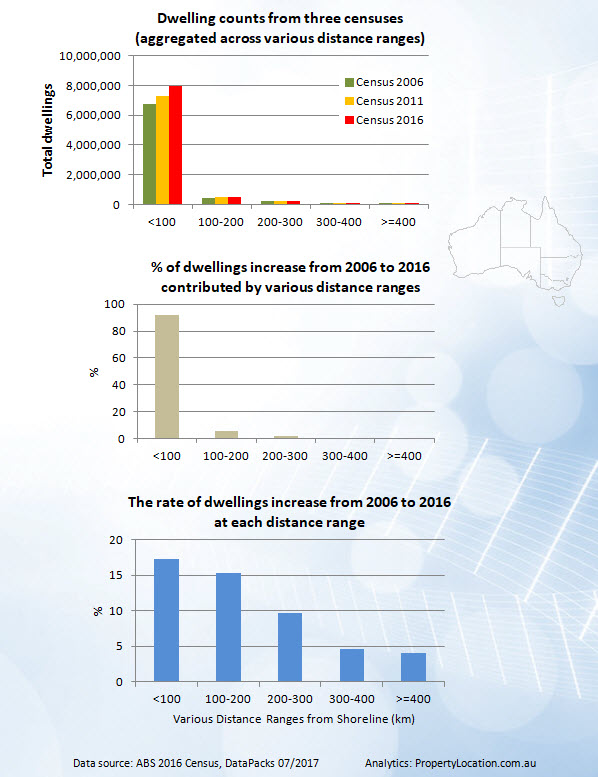
From Figure 1 (top), it is obvious that an overwhelming majority of dwellings are in the coastal region. For each of the three Censuses (2006, 2011 and 2016), about 90% and 96% of all dwellings are located within 100km and 200km of the shoreline, respectively (but with a small, steady increase from Census 2006 to Census 2011 to Census 2016).
About 1.26 millions of new dwellings are recorded from 2006 to 2016, and 92% and 98% of this increase occur within 100km and 200km of the shoreline, respectively (Figure 1, middle).
Moreover, for the distance range within 100km of the shoreline, the rate of increase from 2006 to 2016 is also the highest. As the distance to the shoreline increases, the rate drops quickly (Figure 1, bottom).

Figure 1: Dwelling changes from Censuses 2006, 2011 and 2016 and across various distance ranges to the shoreline (100km resolution).
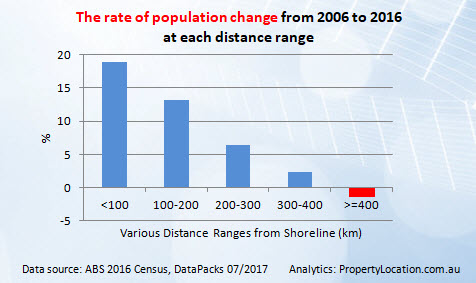
Figure 2: The rate of population change from 2006 to 2016 at each distance range to the shoreline.
At this juncture, it is interesting to compare the rate of changes between dwellings and population at various distance ranges. In Figure 2, as distance to the shoreline increases, the decreasing trend for population is even sharper than that for dwellings. For the inland with distance more than 400km from the shoreline, the population count actually dropped from 2006 to 2016 (a net loss of ~2,000 among a total of ~140,000 persons for the region). People move around while dwellings always stay, and it appears the Censuses accurately captured this small yet significant change.
Detailed look at a resolution of 10km
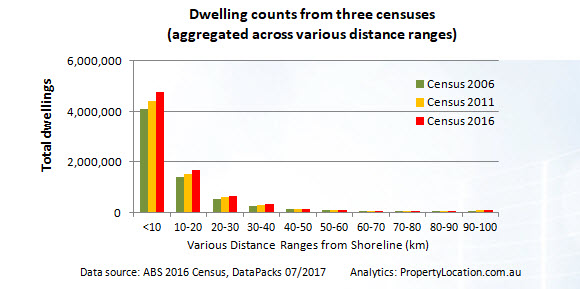
Now we turn attention to the coastal region squarely within 100km of the shoreline, and the exposure distribution is examined at 10km resolution level.
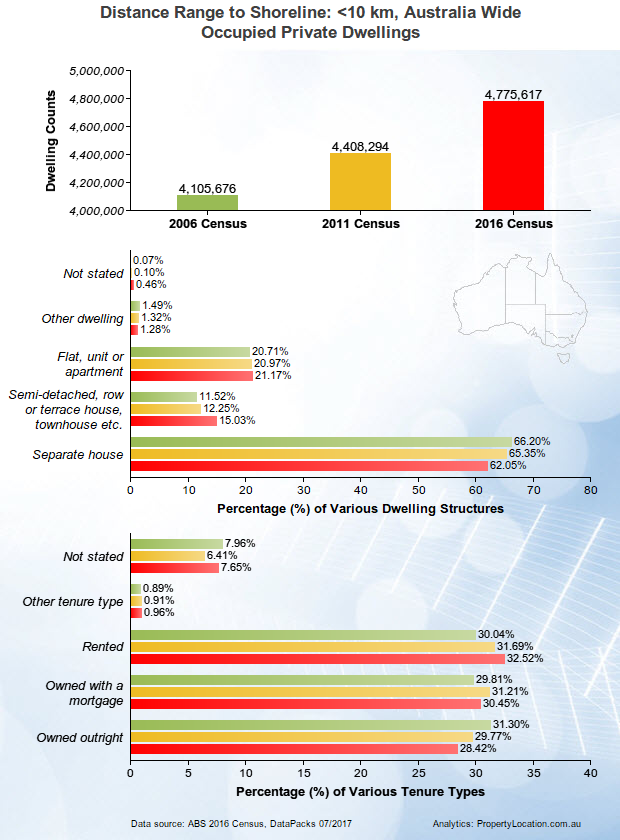
Within 10km of the shoreline, both the absolute increase and the relative rate of increase are also the sharpest among all distance ranges (Figure 3). Again, as distance to the shoreline increases, the exposure decreases quickly.
By combining with the pattern revealed at the broad level above, it is now no difficulty to draw the conclusion that the existing and new exposure is highly concentrated towards the narrow coastal region.


