10 August 2017
The Australian Bureau of Statistics (ABS) has recently released the first batch of 2016 Census data, and its DataPacks can be obtained here.
The new time series profiles on community characteristics provide a unique perspective on how Australian exposure has been changing over the past decade. In this post, we report population and occupied private dwellings (i.e. residential dwellings) and their changes from three national Censuses (2006, 2011 and 2016), at two broad Census geographical areas (Australia wide, and States and Territories).
We have tried to group closely-related metrics into a single chart in order to see the “big picture” more readily.
From 2006 to 2016, some salient national features and trends can be gleaned (Figures 1 and 2):
-
The national ratio of population to private dwellings has been around 2.61 (but with a slight increase from 2.608 to 2.622 to 2.636 in Census 2006, Census 2011 and Census 2016, respectively).
-
The population aged 55 and plus is definitely increasing reflecting the society is ageing, whereas the relative percentage for the young (aged 19 and less) is decreasing and not catching up.
-
The young workforce group (aged 25-34 yeas) is on the steady increase, which is probably supplemented and boosted by young skilled migrants.
-
Among various dwelling structures, the relative percentage for “Separate house” category is declining quickly.
-
Among various tenure types, while the relative percentage for “Owned outright” category is shrinking, that for “Rented” is on the increase.
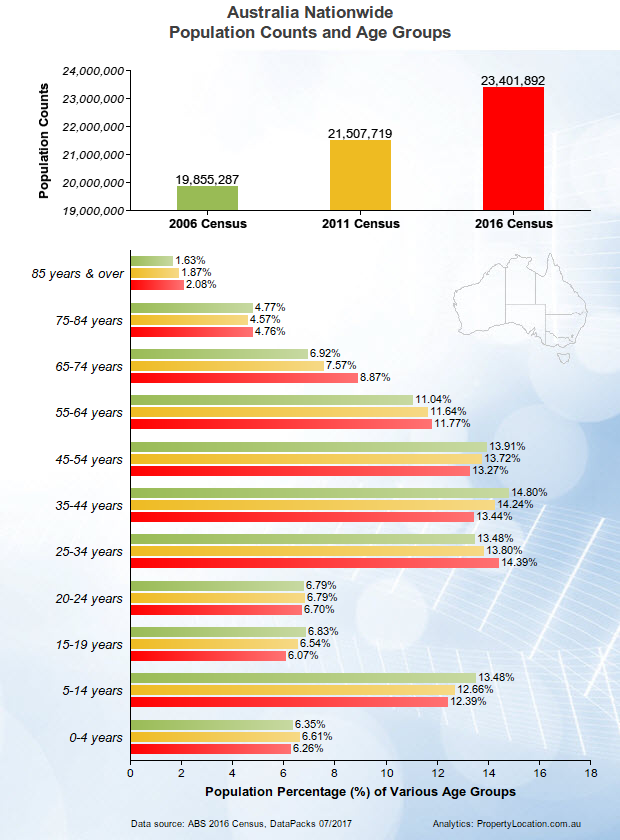
Figure 1: Population changes from Censuses 2006, 2011 and 2016.
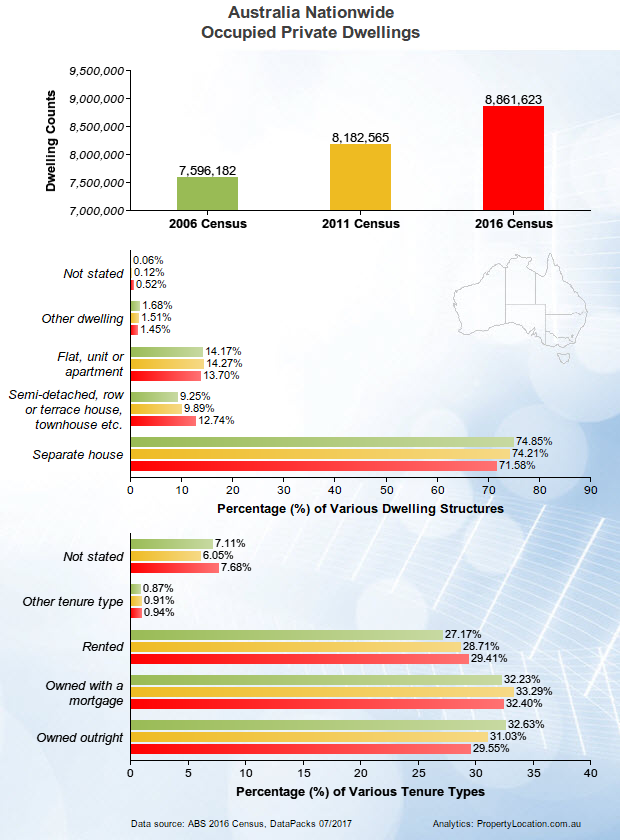
Figure 2: Dwelling changes from Censuses 2006, 2011 and 2016.
It is stressed that these features are observed at the national level across the whole Australia, although they are to a large extent influenced by more populous states such as New South Wales and Victoria.
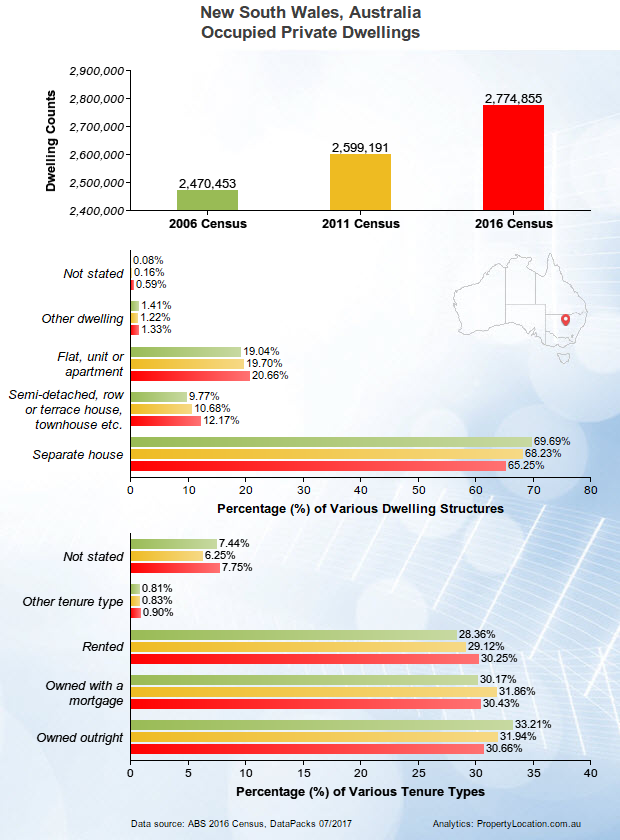
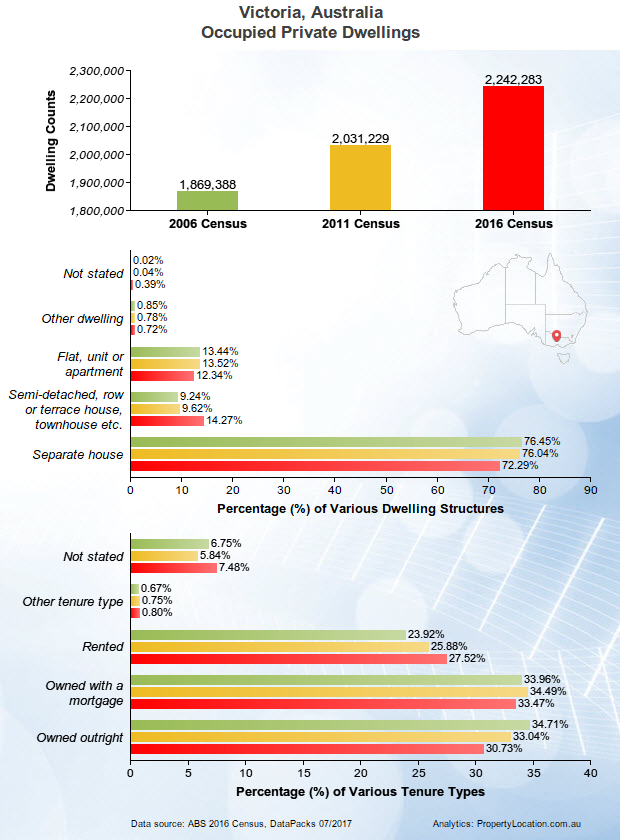
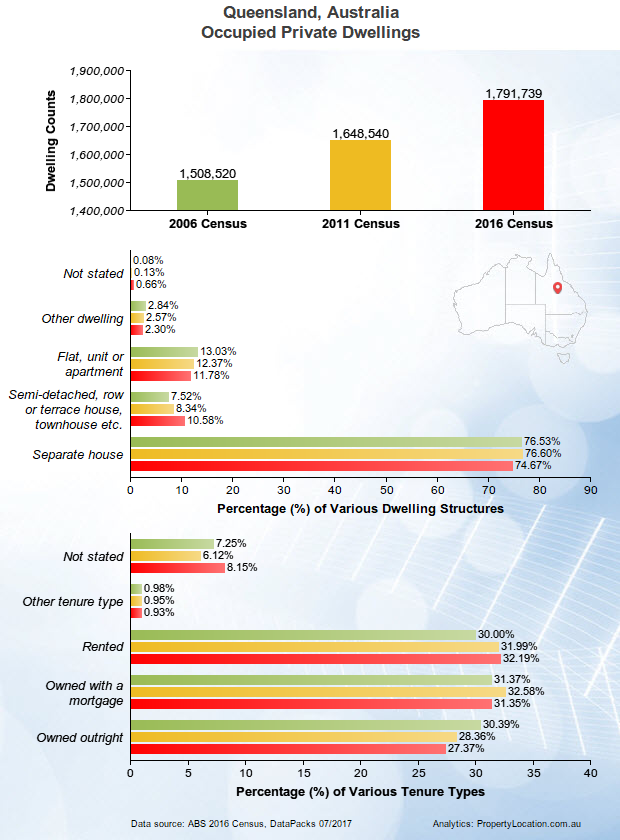
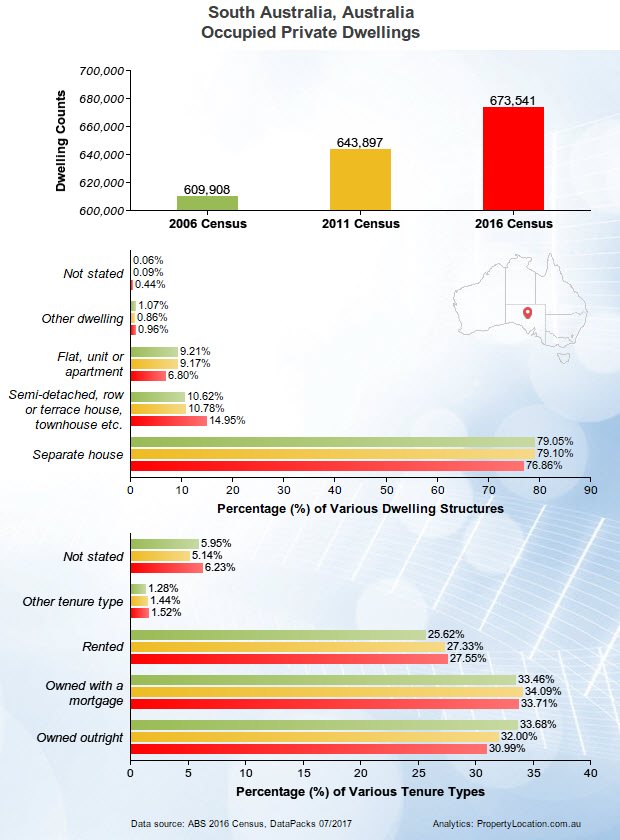
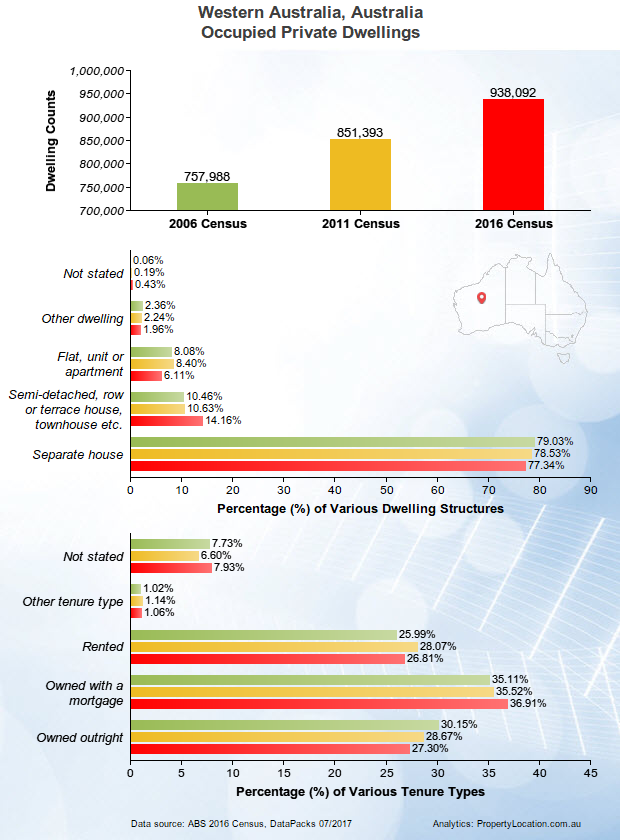
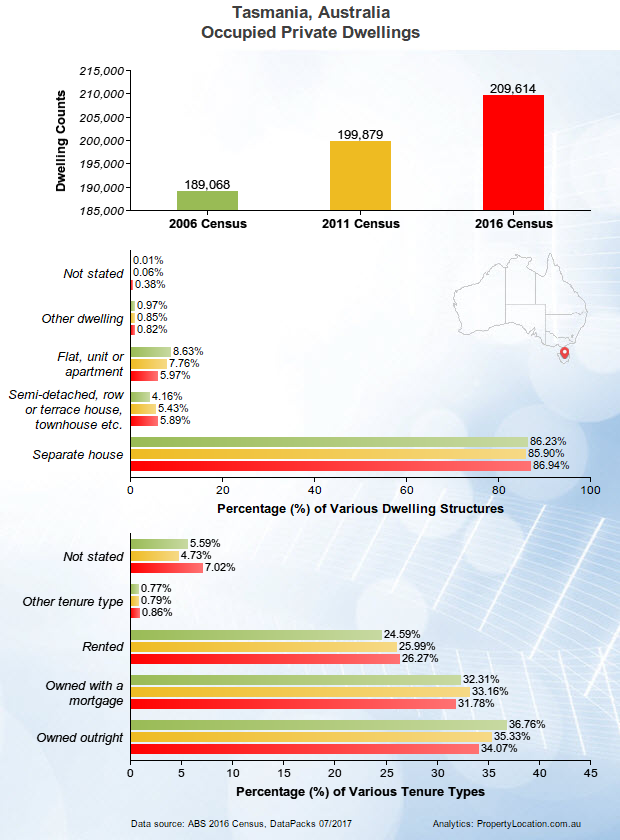
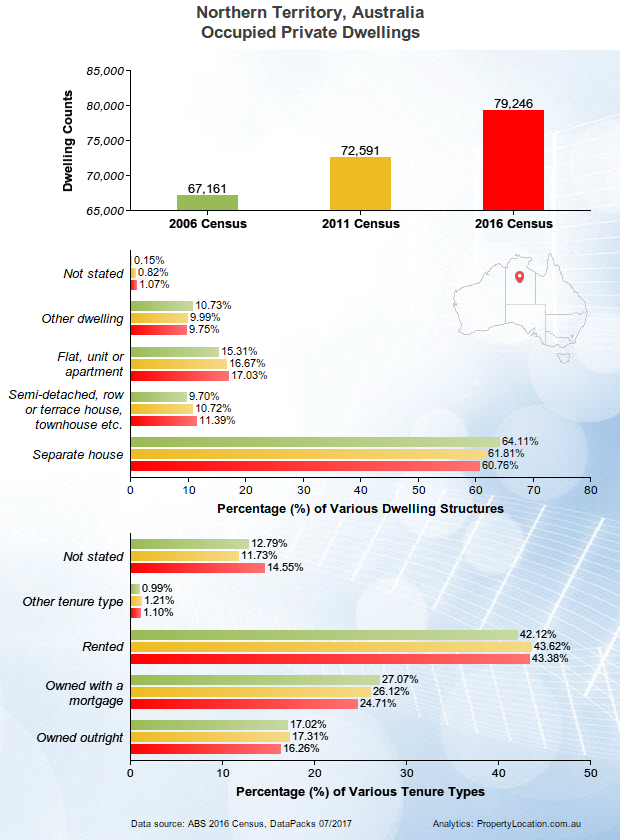
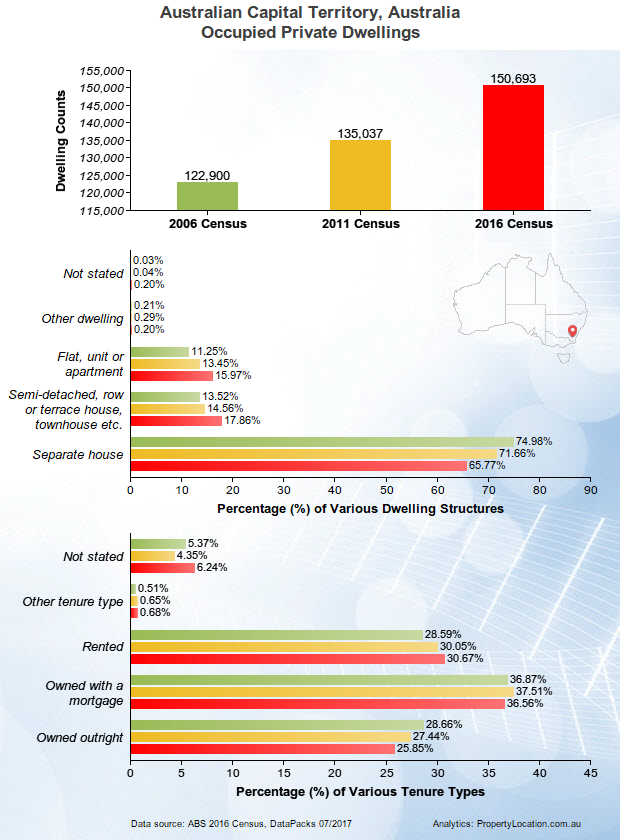
As the Census geographical areas get finer, patterns for changes become more diversified. Figure 3 shows exposure changes for all eight States and Territories. Interested users can download full-resolution charts for interpretations specific to individual regions.
Detailed insights on community characteristics can be revealed at even more granular Census geographical areas, such as Local Government Areas (LGA, e.g. Sydney and Melbourne) and Statistical Area Level 2 (SA2, e.g. Homebush Bay near Sydney Olympic Park). We develop such time series profiles via property location profile reports at https://PropertyLocation.com.au – a new portal for our location-centric business applications.
Our next post will examine how rapid national exposure accumulates in coastal regions from 2006 to 2016.
Notes: The Census of Population and Housing every five years surveys residential private dwellings, not other building types (e.g. commercial, industrial or agricultural). The total number of occupied private dwellings (~8.9 millions) from Census is far less than ~14 millions that are included in the Geocoded National Address File (G-NAF); the latter is a superset for all property addresses in Australia, which involves some duplicates as well.
Charting based on the Census raw data serves two purposes: (1) to see the Census data more quickly and meaningfully; and (2) the pattern shown by the chart provides an opportunity to assess the completeness and accuracy of Census data against other ground-truth data, or sometimes local observations and experiences.

