Blog

Home/Blog/
11 04, 2020

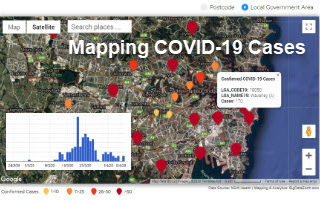
New Web App: Mapping Daily Confirmed COVID-19 Cases in NSW by Postcode and LGA

2020-11-27T23:17:39+11:00April 11th, 2020|Apps, Australia, Census, Cloud Computing, Emergency, Exposure, Geospatial Big Data Analytics, Location Intelligence, Major Events, Risk|

11 April 2020 Strongly motivated by the recent release of more detailed COVID-19 data by the New South Wales (NSW) Government, we have developed a new web app that maps the daily confirmed COVID-19 cases in Sydney and NSW by Postcode and Local Government Area (LGA). Please note that so far the [...]

2 04, 2020

Unique Software Spectral Discovery to Easily and Rapidly Process Sentinel-2 Imagery

2021-01-13T18:26:09+11:00April 2nd, 2020|Agriculture, Asia, Australia, Bushfire, Earth Observation, Emergency, Image Analysis, Major Events, News Media, Risk, Sentinel-2, USA, Wildfire|

2 April 2020 Sentinel-2 (with twin satellites Sentinel-2A and Sentinel-2B) is one of the most successful Earth observation missions from the EU Copernicus Programme and ESA. Sentinel-2 satellite imagery features: wide swath (290km) multiple spectral bands (13 bands) high resolution (four visible and near-infrared bands at 10m, six red-edge/shortwave-infrared bands at 20m, and three [...]

11 03, 2020

Top 10 Blogs of the Past Two Years from BigData Earth

2020-10-03T00:48:53+10:00March 11th, 2020|APIs, Apps, Australia, Bushfire, Cloud Computing, Emergency, Exposure, Flood, Geospatial Big Data Analytics, Insurance, Location Intelligence, Property Information, Risk, Tropical Cyclone, USA|

11 March 2020 Exactly four years ago, we started blogging what we have been exploring and creating in geospatial big data analytics, cloud computing, property location metrics, hazard and risk modelling, etc. So far, more than 50 blogs have been produced. Here we select and share top 10 blogs from the past [...]

9 12, 2019

New Tile Maps on Terrain and Hydrology: Part 3 (Increasing Details)

2020-10-03T00:48:56+10:00December 9th, 2019|APIs, Apps, Australia, Emergency, Exposure, Flood, Geospatial Big Data Analytics, Insurance, Location Intelligence, Property Information, Risk|

9 December 2019 LiDAR point clouds can represent 3D features very accurately, but due to their large data sizes, point clouds are commonly turned into easy-to-use DEMs at various spatial resolutions (e.g. 1m, 5m or 10m). Such DEMs are increasingly available via government web portals. The vertical accuracy of 1m-resolution Lidar-derived DEMs [...]

9 12, 2019

New Tile Maps on Terrain and Hydrology: Part 2 (Extending Coverage)

2020-10-03T00:48:58+10:00December 9th, 2019|APIs, Apps, Australia, Emergency, Exposure, Flood, Geospatial Big Data Analytics, Insurance, Location Intelligence, Property Information, Risk|

9 December 2019 Many of us work with elevation data (e.g. LiDAR point clouds and Digital Elevation Models - DEMs) on a daily basis. Nowadays there are an increasing number of government sources for open elevation data, including high-quality, LiDAR-derived DEMs. As we have recently introduced (link to the previous blog), elevation data [...]

18 09, 2019

New Tile Maps on Terrain and Hydrology: Part 1 (Enriching Google Maps)

2020-10-16T00:28:14+11:00September 18th, 2019|APIs, Apps, Australia, Emergency, Exposure, Flood, Geospatial Big Data Analytics, Insurance, Location Intelligence, Property Information, Risk|

18 September 2019 Google Maps is very popular and easy to use, and many of us would have imagined creating and delivering domain-specific mapping layers in the same or similar way Google Maps does. To realise this, we have recently created and released a set of new, high-resolution tiled web maps (or tile [...]

12 08, 2019

New R&D in Property Location and Hazard Risk Analytics: A Transformative Journey from Desktop Computing to Cloud Computing

2021-03-08T14:10:46+11:00August 12th, 2019|APIs, Apps, Asia, Australia, Emergency, Exposure, Flood, Geospatial Big Data Analytics, Insurance, Location Intelligence, Property Information, Risk, USA|

12 August 2019 Over the past four years we have been undertaking significant new R&D in property location and hazard risk analytics with cloud computing. In particular, we have developed an organic set of products based on three new technologies (Web APIs, Web Apps and Web Maps) to support two cloud-based geospatial [...]

18 06, 2019

Applications of New National Contour Web Maps: Part 3 (Identifying Riverine Flood-prone Areas)

2020-10-03T00:49:05+10:00June 18th, 2019|APIs, Apps, Australia, Emergency, Exposure, Flood, Geospatial Big Data Analytics, Insurance, Location Intelligence, Property Information, Risk|

18 June 2019 We keep showcasing the potential application of new high-resolution contour web maps for Australia that have been recently developed (link). Previous blogs in this series include: Applications of New National Contour Web Maps: Part 2 (Identifying Low-lying Coastal Areas) - link Applications of New National Contour Web Maps: Part [...]

3 06, 2019

Applications of New National Contour Web Maps: Part 2 (Identifying Low-lying Coastal Areas)

2020-10-03T00:49:07+10:00June 3rd, 2019|APIs, Apps, Australia, Emergency, Exposure, Flood, Geospatial Big Data Analytics, Insurance, Location Intelligence, Property Information, Risk|

3 June 2019 We keep demonstrating the potential use of new national contour web maps that have been developed in a recent flood risk analytics project (link). Previous blogs in this series include: Applications of New National Contour Web Maps: Part 1 (Enhancing High-resolution Imagery Mapping) - link In this blog we [...]

30 05, 2019

Applications of New National Contour Web Maps: Part 1 (Enhancing High-resolution Imagery Mapping)

2020-10-03T00:49:08+10:00May 30th, 2019|APIs, Apps, Australia, Emergency, Exposure, Flood, Geospatial Big Data Analytics, Insurance, Location Intelligence, Property Information, Risk|

30 May 2019 In the previous blog, we reported a national flood risk analytics project that has produced a set of high-resolution tiled web maps on elevation contextual layers and terrain metrics, including contours, modelled surface water flow directions and shaded relief. These web maps are also complementary to desktop, web or mobile [...]

Go to Top