16 October 2017
The catastrophic wildfires in Northern California started a week ago have claimed at least 40 lives and destroyed nearly 6,000 buildings (news report). The fires continuously burning over the past week and the extensive damage have been observed by low-, medium- and high-resolution satellite imagery. Here we summarise and analyse a few useful imagery sources. In the end, we also briefly introduce two unique imagery and information products as resources from BigData Earth that can be used to assess wildfire risk in California.
1. Low-resolution Satellite Imagery
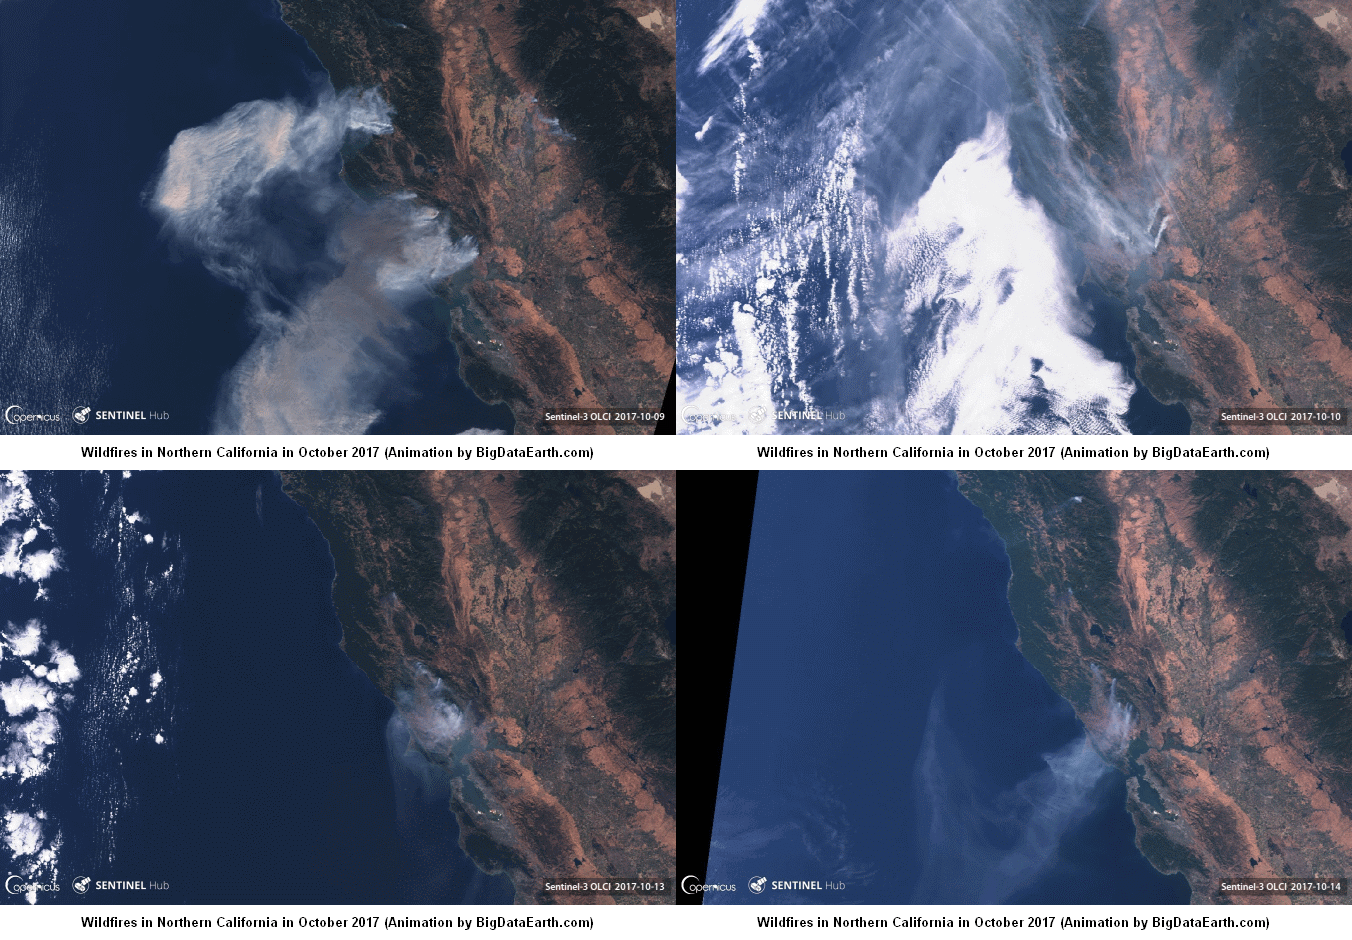
The latest Sentinel-3 Ocean and Land Colour Instrument (OLCI) imagery (~300m resolution) from the European Copernicus Earth Observation Program and ESA offers an excellent regional view about the sheer magnitude of fire outbreaks and the daily evolution of conflagrations. Figure 1 shows an animation of the fires from October 9/10 to October 13/14.

Figure 1: The time series of Sentinel-3 imagery from October 9/10 to October 13/14.
2 – Medium-resolution Sentinel-2 and Landsat-8 Imagery
The Santa Rosa and Napa region suffered the most significant destruction. It was observed by the 10m-resolution Sentinel-2 and 15m-resolution Landsat-8 imagery. We have developed an automated image analysis approach – from advanced image fusion to exploratory feature extraction to output presentation – for such high-quality and increasingly important imagery sources. The following shows processed images over three consecutive days (October 10, 11 and 12) for the fire ravaged region.
2.1 – Imagery on October 10
#California #wildfires near Santa Rosa | October 10, 2017 #sentinel2 #CaliforniaFires @CopernicusEMS pic.twitter.com/XZiyzupSXF
— BigData Earth (@BigDataEarth) October 14, 2017
2.2 – Imagery on October 11
#California #wildfires near Santa Rosa | October 11, 2017 #Landsat #CaliforniaFires @USGSLandsat @NASA_Landsat pic.twitter.com/uNo1JMdgAY
— BigData Earth (@BigDataEarth) October 14, 2017
2.3 – Imagery on October 12
#California #wildfires near Santa Rosa | October 12, 2017 #sentinel2 #CaliforniaFires @CopernicusEMS pic.twitter.com/xW6OZS1B5e
— BigData Earth (@BigDataEarth) October 14, 2017


