9 December 2019
LiDAR point clouds can represent 3D features very accurately, but due to their large data sizes, point clouds are commonly turned into easy-to-use DEMs at various spatial resolutions (e.g. 1m, 5m or 10m). Such DEMs are increasingly available via government web portals.
The vertical accuracy of 1m-resolution Lidar-derived DEMs is typically less than 50cm RMSE (link), and it is conservative to choose an interval of 50cm to represent derived contour maps. In this blog, we introduce new work that for some important study areas, 1m-resolution DEMs are analysed to produce detailed tile maps (on terrain and hydrology), which can then be readily used for web and desktop GIS mapping.
Related processing components and many case studies have been given in previous blogs (links to Blog 1 and Blog 2). Here we use 1m-resolution LiDAR-derived DEMs from Geoscience Australia’s Elevation Information System (ELVIS) and the USGS 3D Elevation Program for new tile maps.
Application 1: Zoomed view of flood-prone areas
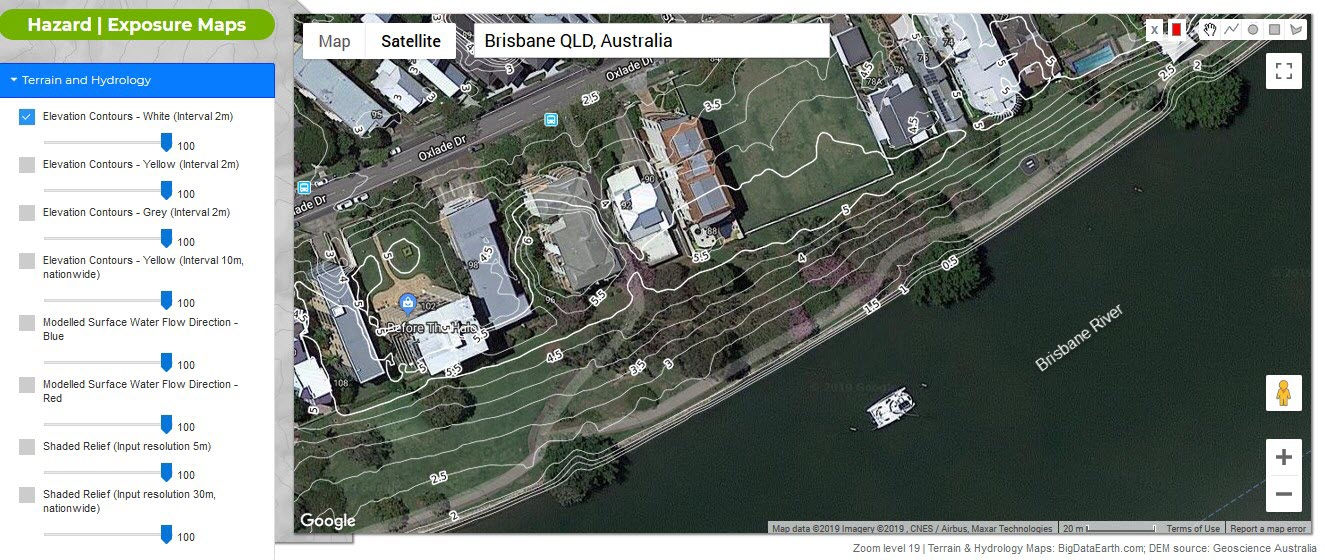
Figures 1 and 2 show detailed views of underlying elevation for two areas next to the Brisbane River, Queensland. Given the contours at 50cm intervals, one can easily visualise the likely inundation as water level increases. It would be hard to effectively communicate this type of dynamic or scenario-based information to the public without such detailed scalable maps.
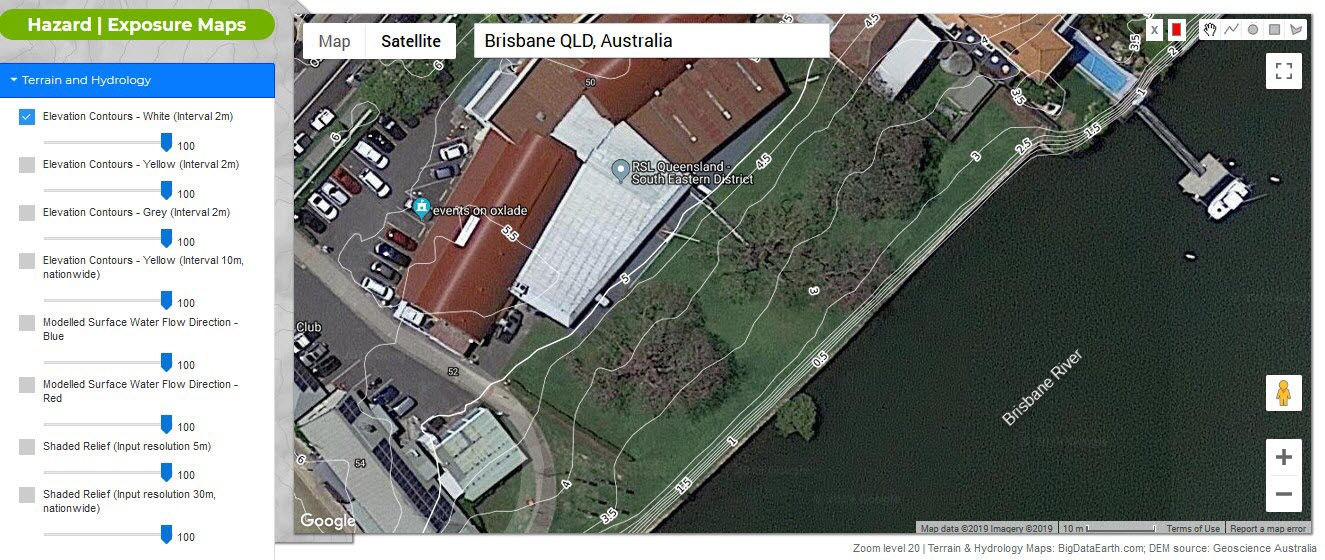
Figure 1: Tile maps showing flood-prone areas with 50cm-interval contours (Brisbane, Australia)
Figure 2: Tile maps showing flood-prone areas with 50cm-interval contours (Brisbane, Australia)
Application 2: Zoomed view of low-lying coastal areas
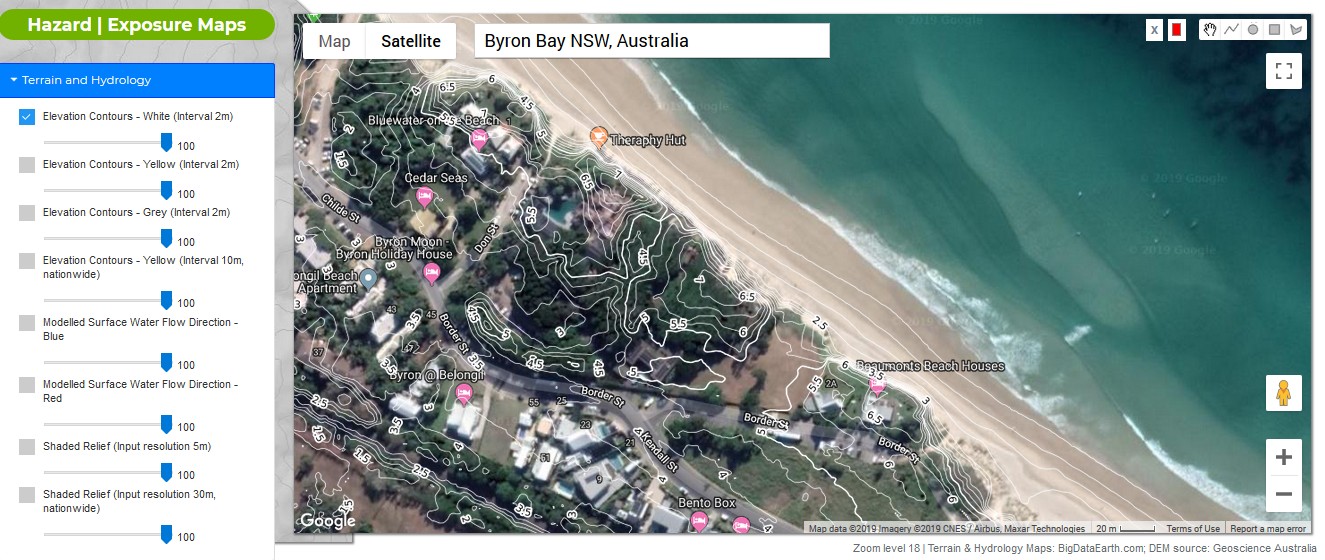
Figure 3 shows detailed tile maps for Byron Bay (NSW, Australia), an area which is very vulnerable to coastal erosion and coastal flooding (e.g. sea level rise and storm surges). One can use such maps to determine which parts of the coast or which dwellings are more at risk.
Figure 3: Tile maps showing low-lying coastal areas with 50cm-interval contours (Byron Bay, NSW, Australia)
Application 3: Zoomed view of ground features
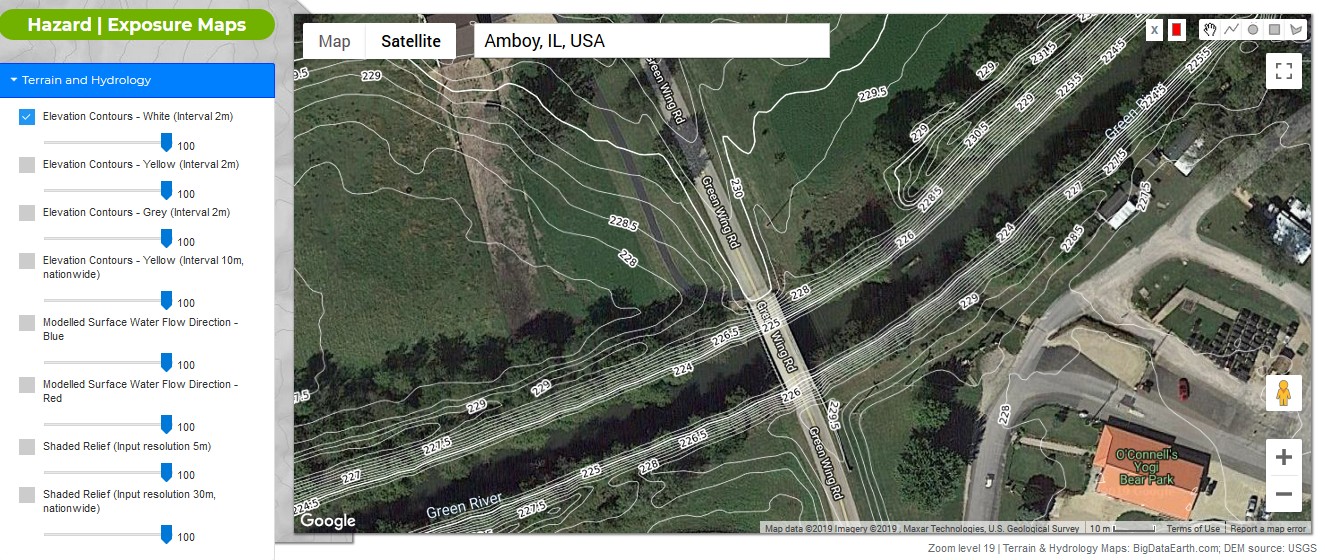
Important ground features (e.g. levees and roads) can alter flood hazard levels and inundation extent. The use of zoomable tile maps to quantitatively represent such features is straightforward and effective (Figures 4 and 5). Many site-level environmental and engineering investigations need this level of detailed representation.
Figure 4: Shaded relief map showing levees and roads in detail (Location: IL, the U.S.; Data source: USGS)


