9 December 2019
Many of us work with elevation data (e.g. LiDAR point clouds and Digital Elevation Models – DEMs) on a daily basis. Nowadays there are an increasing number of government sources for open elevation data, including high-quality, LiDAR-derived DEMs.
As we have recently introduced (link to the previous blog), elevation data can be quickly processed to make versatile tile maps (on terrain and hydrology), which can then be readily consumed by web and desktop GIS mapping.
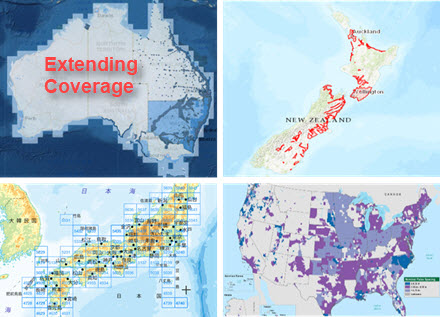
In this blog, we showcase our recent work that uses LiDAR-derived DEMs from overseas countries (Figure 1) and produces high-resolution tile maps for modern geospatial mapping. Background information of the project (e.g. working with Australian DEMs and major processing steps) can be found in the previous blog.
Public DEM data sources can be obtained via government portals, e.g.
-
Australia – Geoscience Australia – ga.gov.au
-
New Zealand – Land Information NZ – linz.govt.nz
-
Japan – Geospatial Information Authority of Japan – gsi.go.jp
-
United States – USGS – 3D Elevation Program – usgs.gov
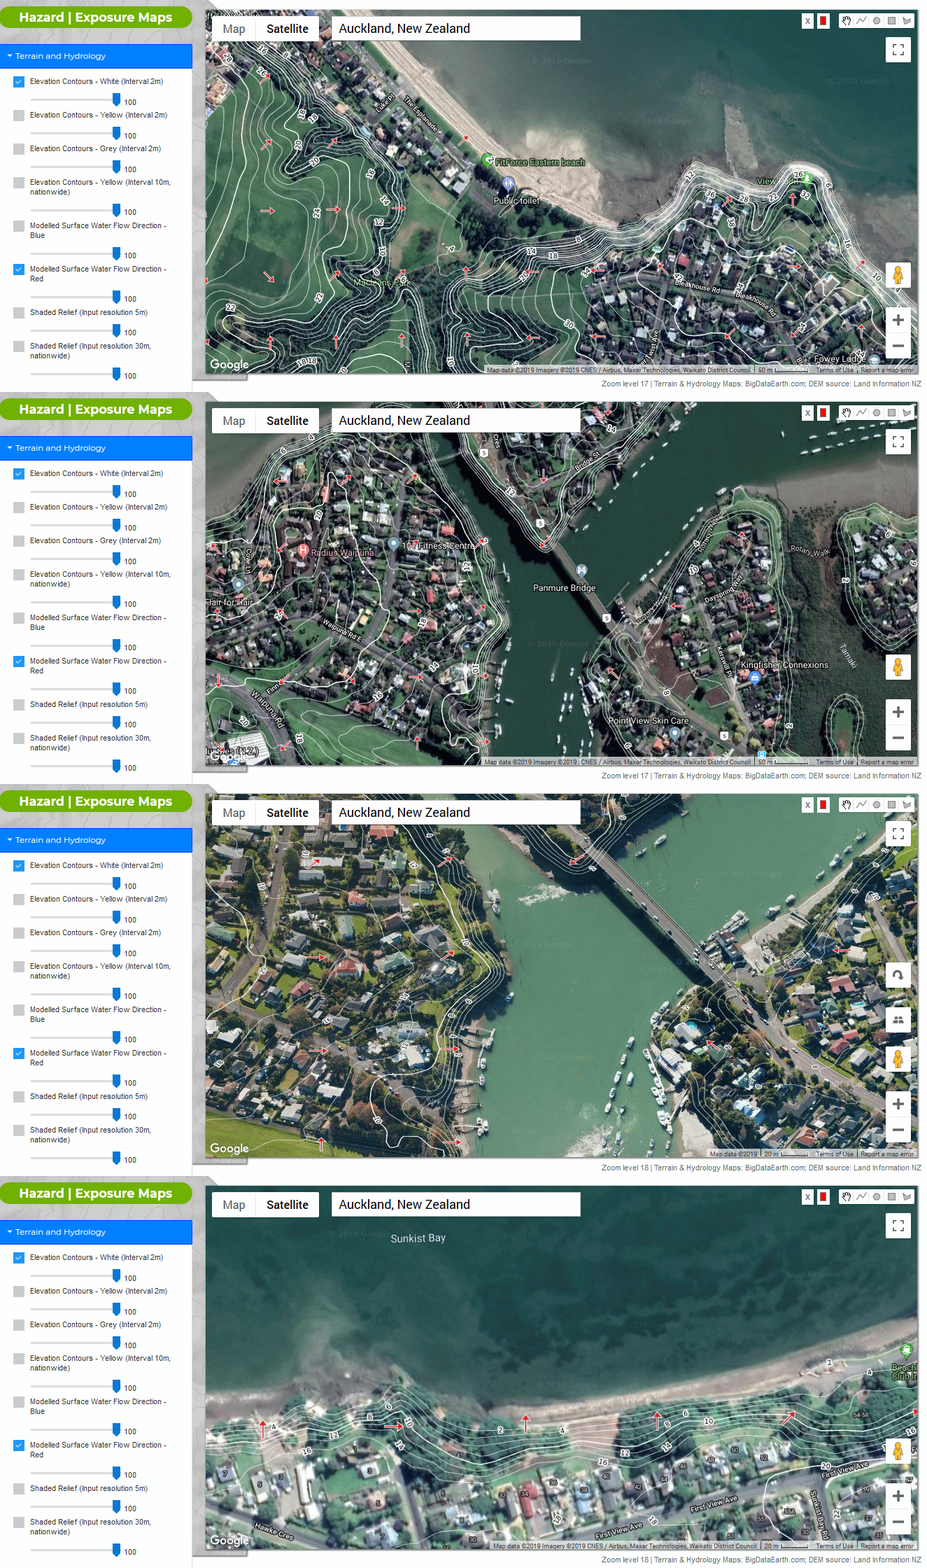
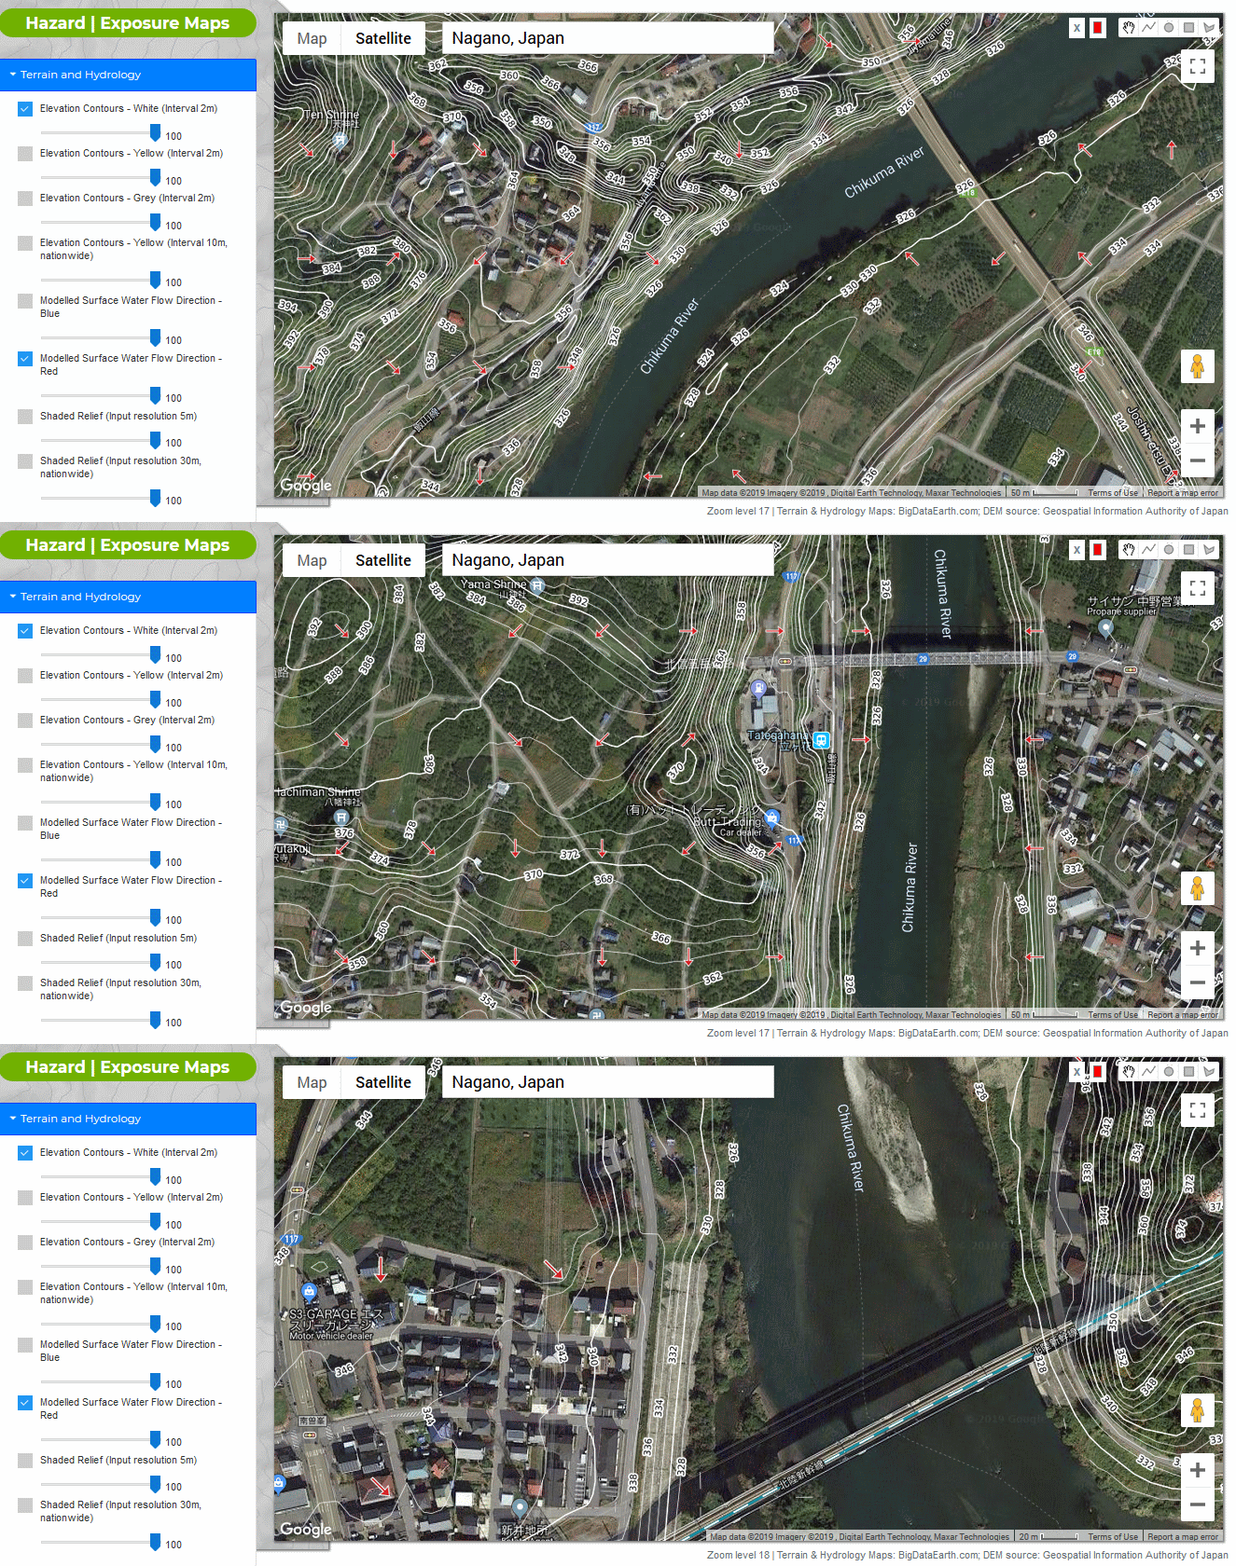
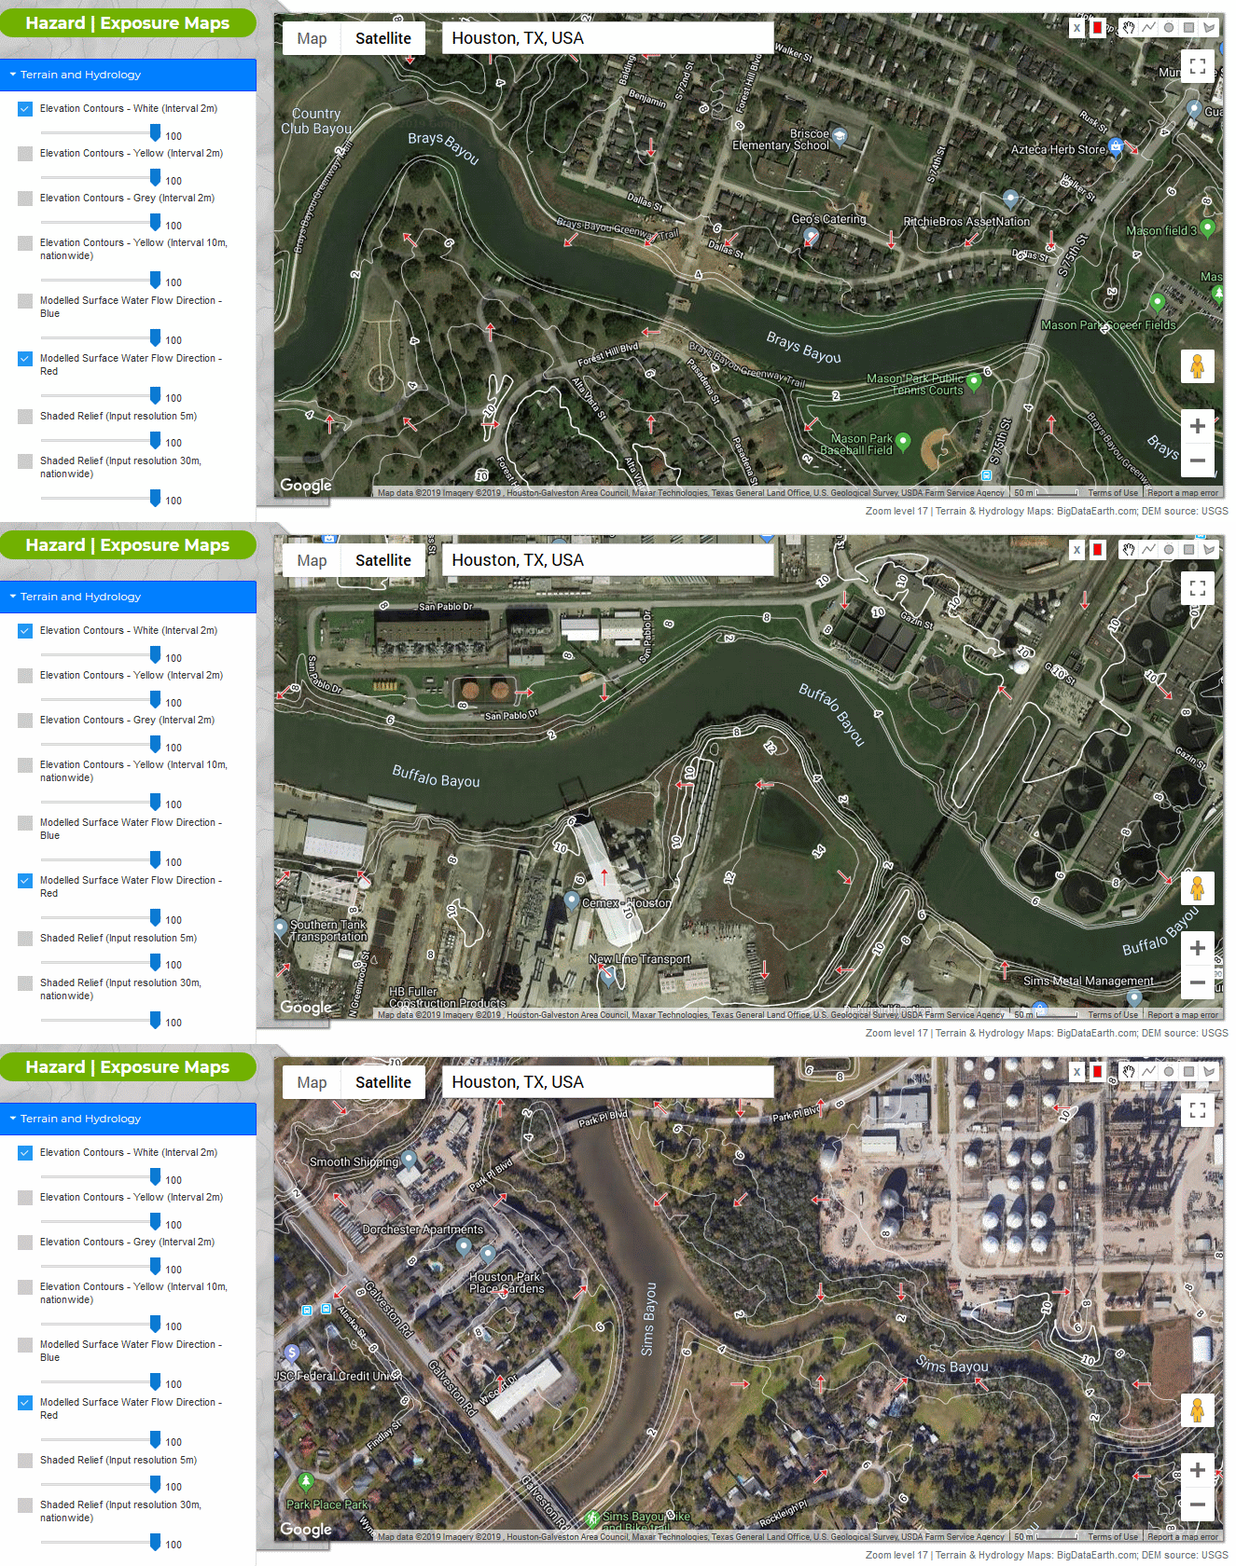
Figures 2-4 show processed tile maps (on contours and modelled surface water flow directions) for areas in New Zealand, Japan and United States, respectively. We have used Google Maps in a web mapping app but the same tile maps can be superimposed over the basemaps from other vendors.
Applications
Created tile maps are probably most useful for environmental and engineering studies. For example, Figure 3 shows flood-prone areas along the Chikuma River (Japan) that were severely inundated after the October 2019 Typhoon Hagibis. Figure 4 shows low-lying areas in Houston (the U.S.), where catastrophic flooding occurred after the August 2017 Hurricane Harvey made landfall.
Our next blog in this series will introduce our new work that uses 1m-resolution LiDAR-derived DEMs to produce even more detailed tile maps. If you are interested in live demos or access, please let us know.
If you are interested in any customised processing, more information is available (PDF).
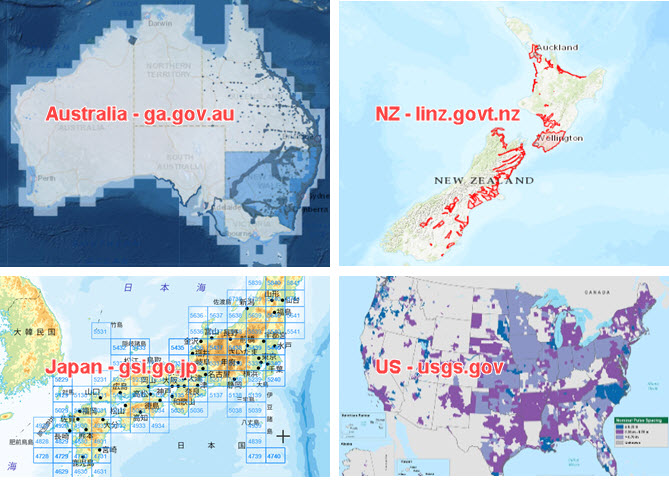
Figure 1: Government portals for public elevation data sources
(e.g. Australia, New Zealand, Japan and United States)
Figure 2: An example of tile maps on terrain and hydrology (New Zealand)
Figure 3: An example of tile maps on terrain and hydrology (Chikuma River, Japan)
Figure 4: An example of tile maps on terrain and hydrology (Houston, the U.S.)


