18 September 2019
Google Maps is very popular and easy to use, and many of us would have imagined creating and delivering domain-specific mapping layers in the same or similar way Google Maps does. To realise this, we have recently created and released a set of new, high-resolution tiled web maps (or tile maps) on terrain and hydrology suitable for a range of environmental and engineering applications in Australia.
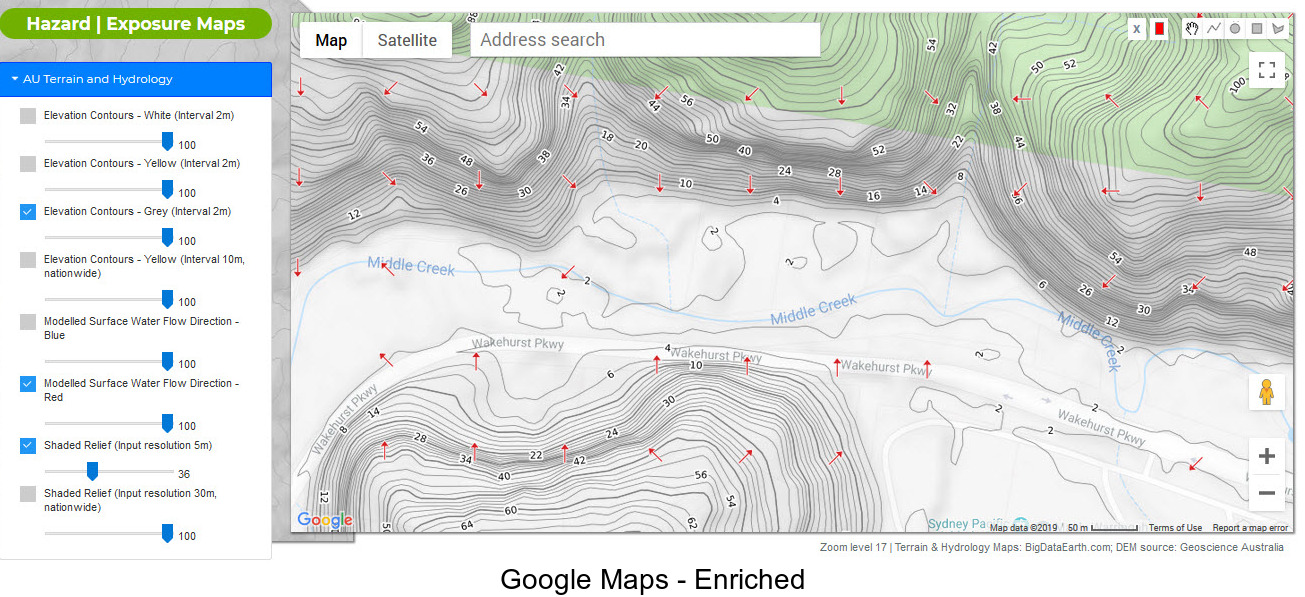
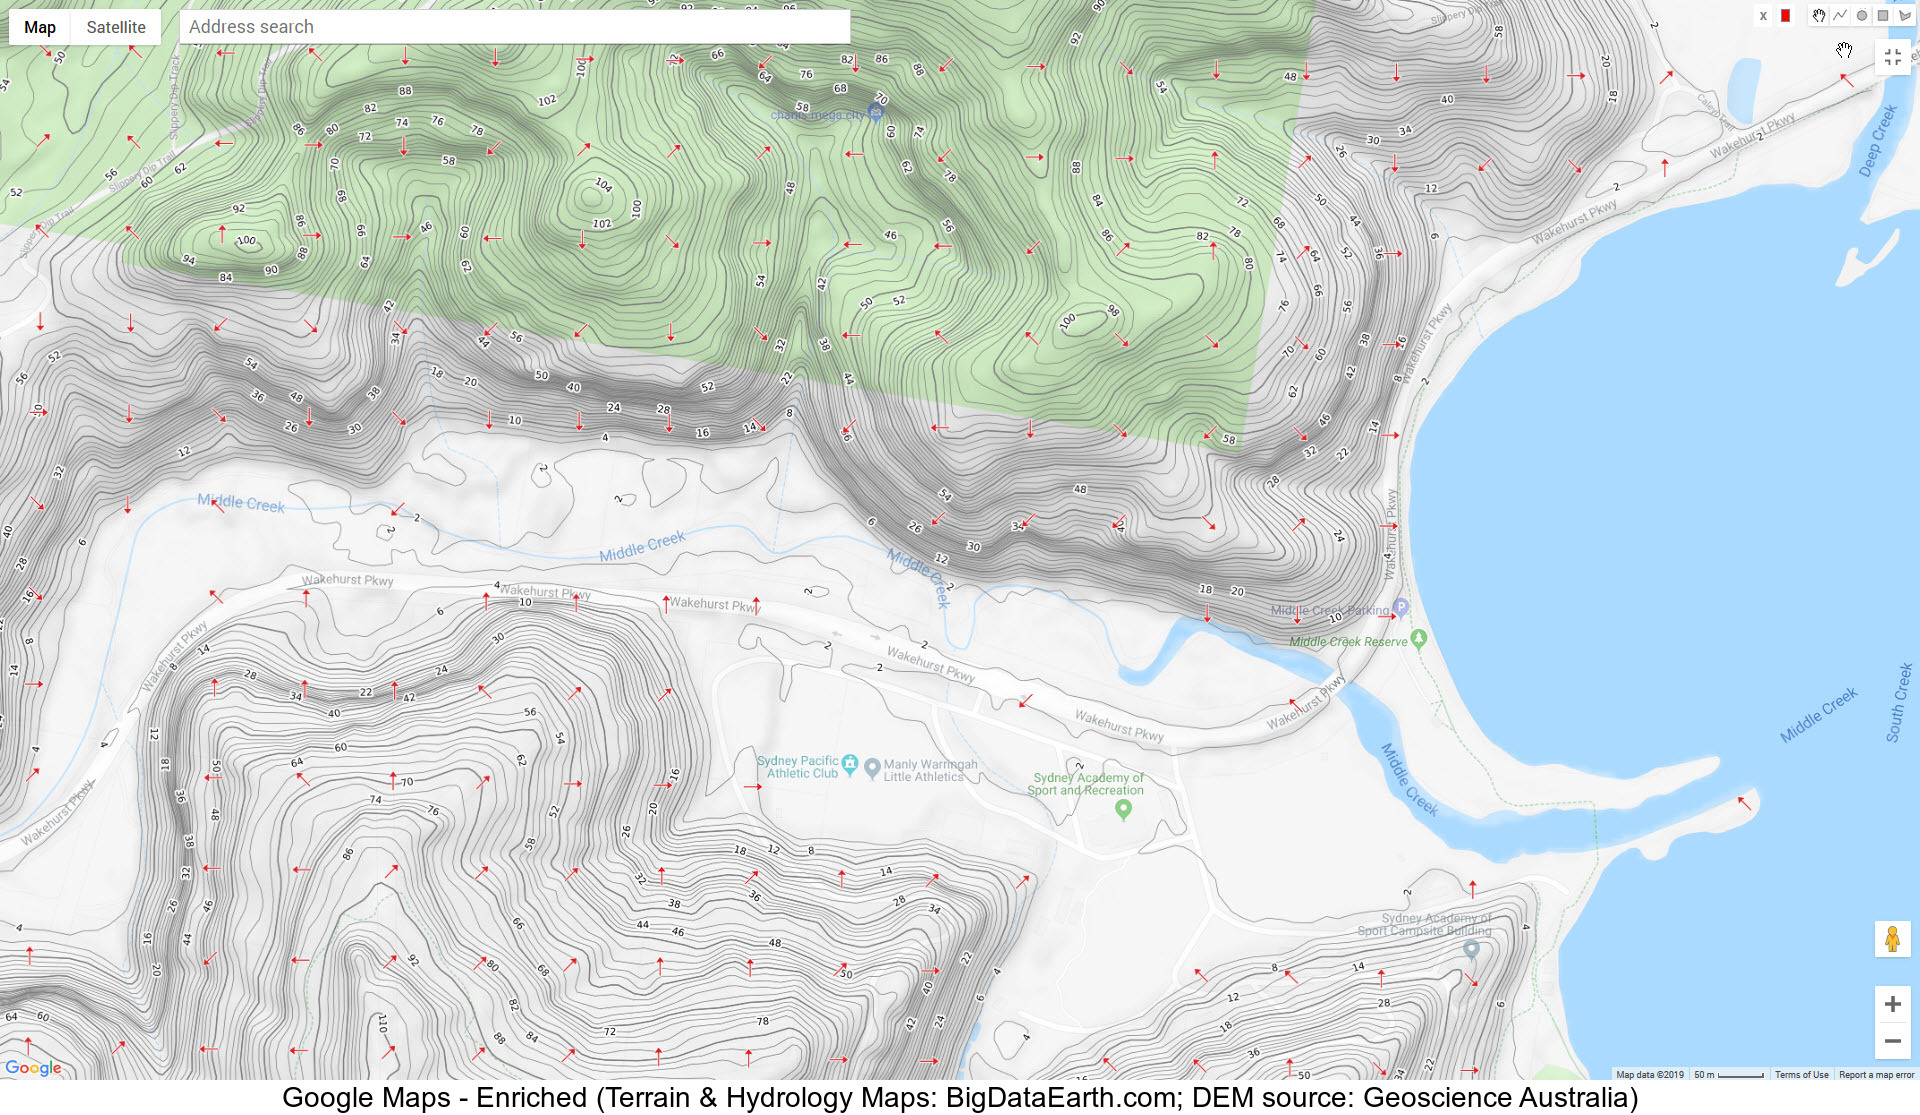
Google Maps already has terrain layers (e.g. contour and shaded relief), but they are at medium resolutions and will disappear when zoom levels get higher (e.g. zoom levels from 15 to 16). This is actually a common situation for similar terrain maps from other vendors as many use 30m-resolution global DEM as an input and 10m-interval contours for visualisation. For many detailed and accurate environmental investigations, especially at a site level, this is not enough. Our tile maps on terrain and hydrology are based on 5m-resolution LiDAR-derived DEM, which is publicly available from Geoscience Australia, and include 2m-interval contours for display and the zoom level up to 19 (~0.3m resolution) for capital cities.
Major components
The whole project includes the following major components each with a unique set of analytical and technical challenges:
-
Input (pre-processing DEMs to a clean, analysis-ready form)
-
Output (covering broad themes – contours, shaded relief and modelled surface water flow directions)
-
Scaling up from a small area to a national level
-
Cartography and map styling
-
Delivery via Web APIs (ready for web, mobile and desktop GIS mapping via APIs)
Background information of the project, in the context of investigating flood-prone locations in Australia, can be found here (link). The implementation of more than a half-dozen web services have made this project possible.
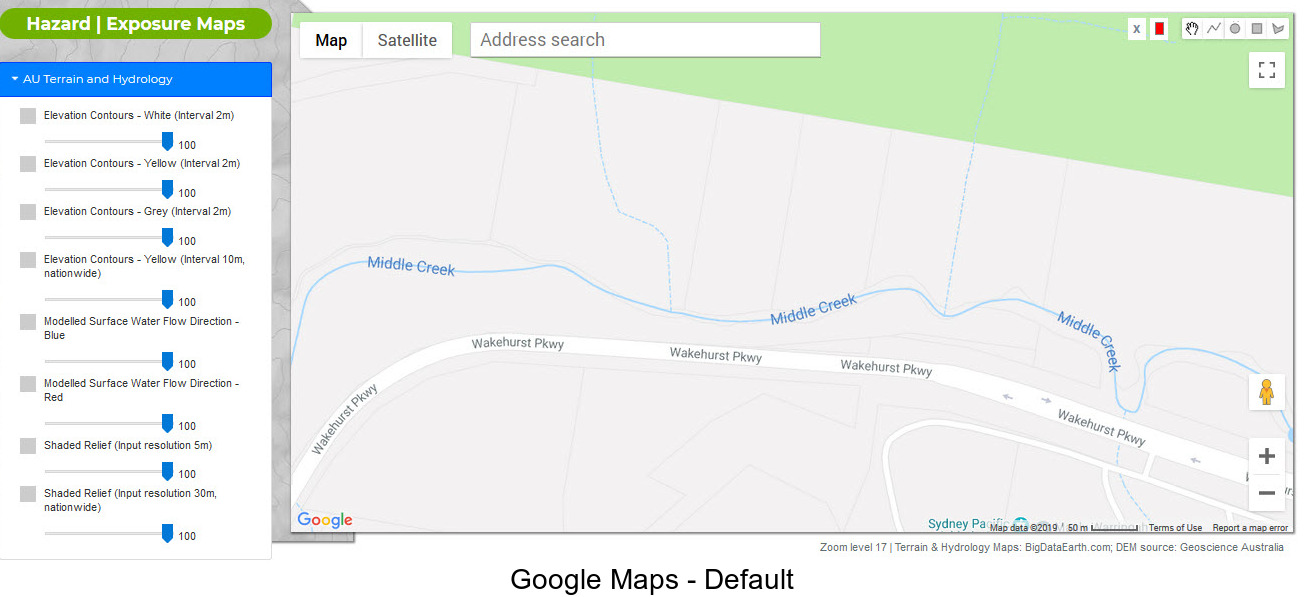
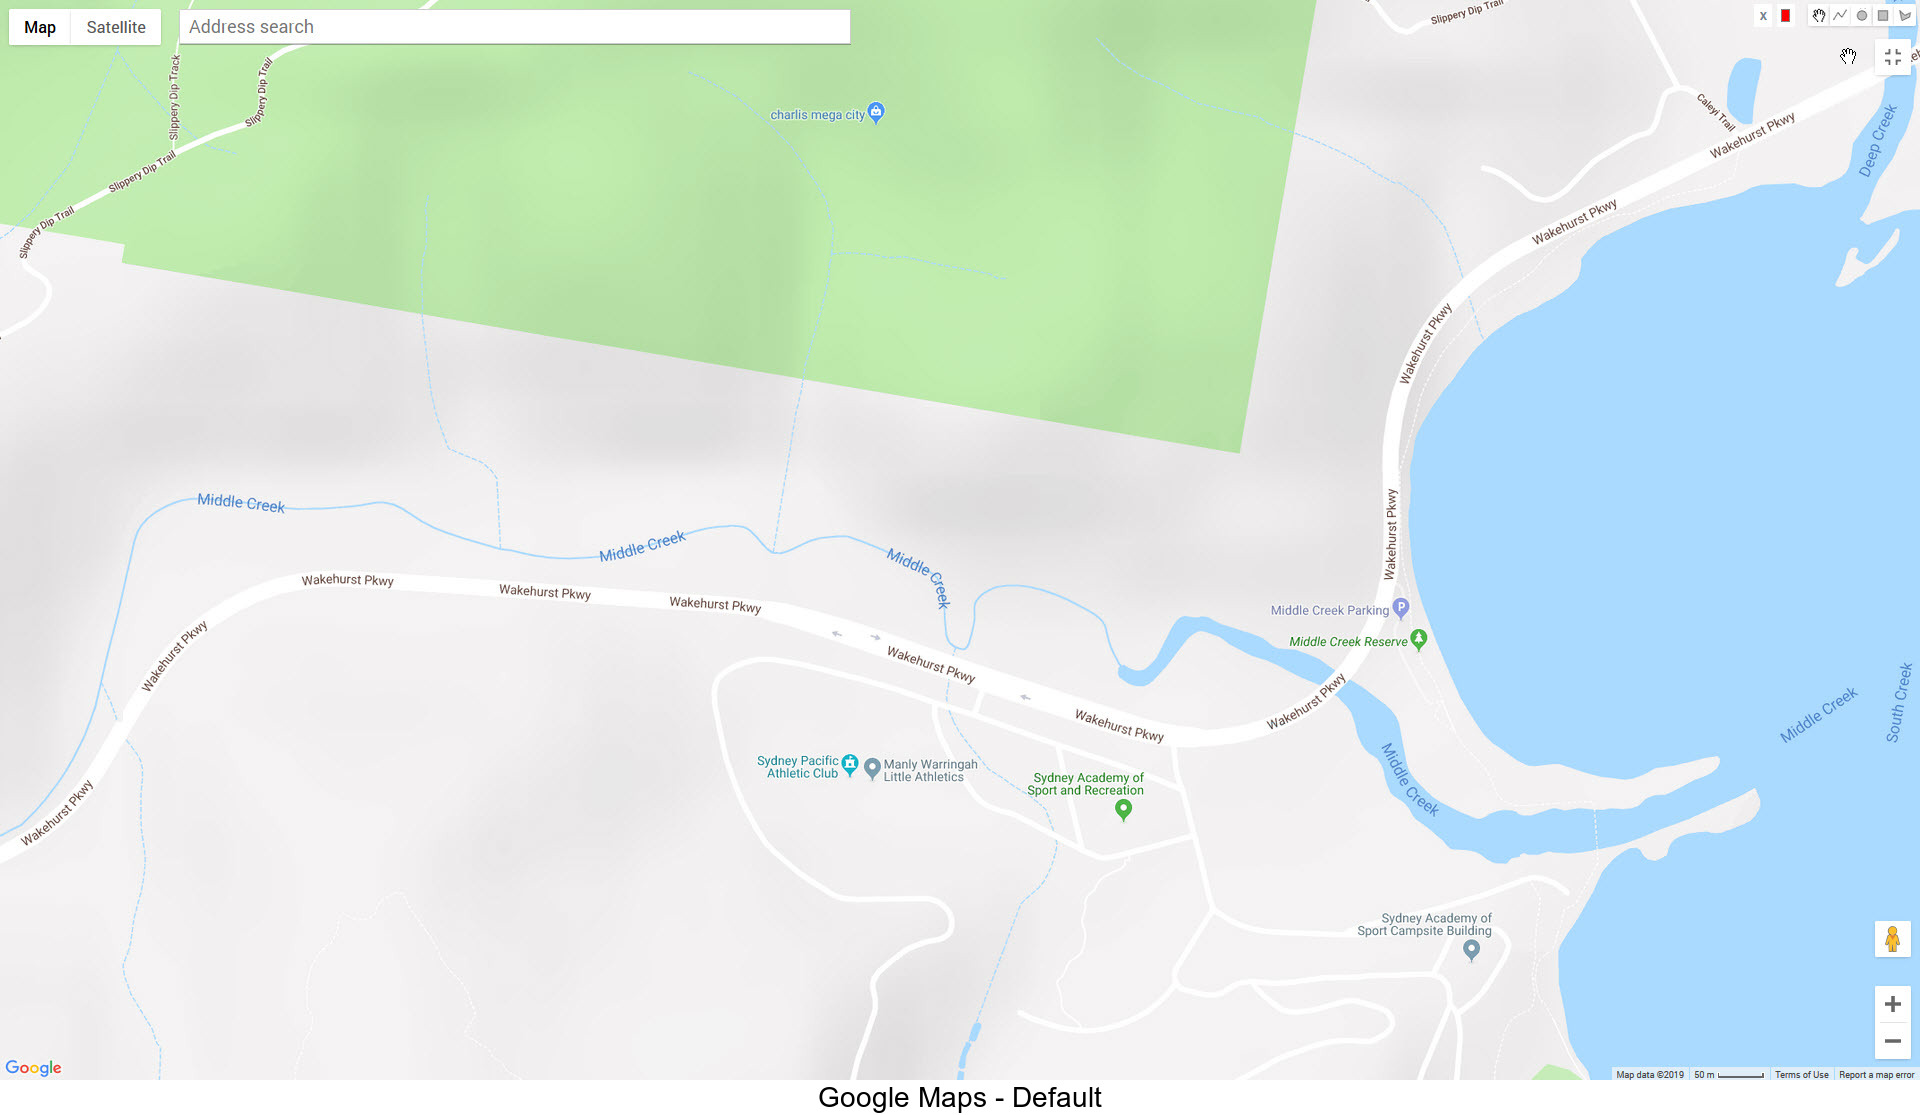
Figures 1 and 2 show a direct comparison: default Google Maps vs. the map enriched with high-resolution layers on terrain and hydrology at a zoom level of 17 (~1.2m resolution). Figures 3 and 4 make a similar comparison but for a larger area. (Many more examples can be found at our previous related blogs: link 1, link 2 and link 3)
Our next blog (in a series of 3 parts) will introduce this project being extended to other countries, including New Zealand, Japan and the U.S. If you are interested in live demos or access, please let us know.
If you are interested in any customised processing, more information can be found here (PDF).

Figure 1: An example of Google Maps – default (for a location in Sydney)
Figure 2: An example of Google Maps enriched with high-resolution mapping layers on terrain and hydrology (zoom level 17)
Figure 3: An example Google Maps – default (for a location in Sydney)
Figure 4: An example of Google Maps enriched with high-resolution mapping layers on terrain and hydrology (zoom level 17)


