22 October 2018
This project is focused on the analysis of historical tropical cyclones (also known as hurricanes or typhoons) and related wind records, including track positions, wind speed and central pressure. We have developed an automated process of carrying out such analyses on the cloud and enabled by web APIs. A straightforward API call can return a full location profile / information report (in PDF) on historical cyclones within seconds. Related Location Profile APIs include:
Two most well-known, publicly-available tropical cyclone databases are sourced and analysed:
-
Atlantic hurricane database (HURDAT2, 1851-2017) from the NOAA National Hurricane Center (NHC)
-
The International Best Track Archive for Climate Stewardship (IBTrACS v03r10, released September 2017) from the NOAA National Climatic Data Center (NCDC)
Data sources and associated publications are acknowledged in reports. Currently, we develop analysis and reporting specific to three major tropical cyclone basins or regions (Figures 1 and 2):
-
North Atlantic (using HURDAT2 , 1851-2017)
-
Western North Pacific (using IBTrACS, up to 2016 season)
-
Australia (using the the Australian Bureau of Meteorology data contained in IBTrACS, up to 2017 season)
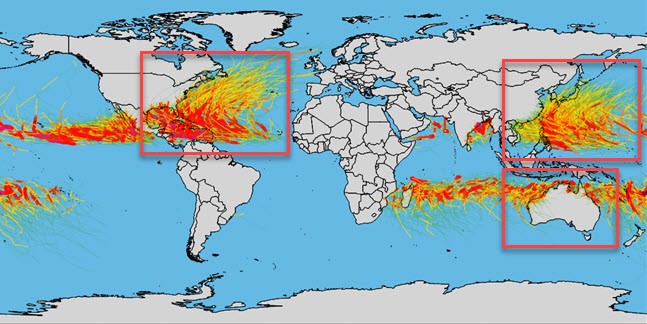
Figure 1: Project geographic coverage with three tropical cyclone regions highlighted
For the Western North Pacific basin, individual datasets from the following four (international, national or regional) centres / agencies, which were contained in IBTrACS, are analysed:
-
Joint Typhoon Warning Center (JTWC)
-
Japan Meteorological Agency (Tokyo, as a WMO Regional Specialised Meteorological Center)
-
China Meteorological Administration (CMA)
-
Hong Kong Observatory (HKO)
Each dataset has its own lineage, including coverage, duration, wind intensity measurement units, and other issues that may pose uncertainties. We include those key contributing datasets to enable any potential comparisons readily. (Uncertainties surrounding wind intensity estimates due to changes in observational procedures over time have been widely reported in many publications. This limitation may be alleviated in the future as data from new wind-observation satellites, e.g. ESA’s Aeolus, becomes available.)
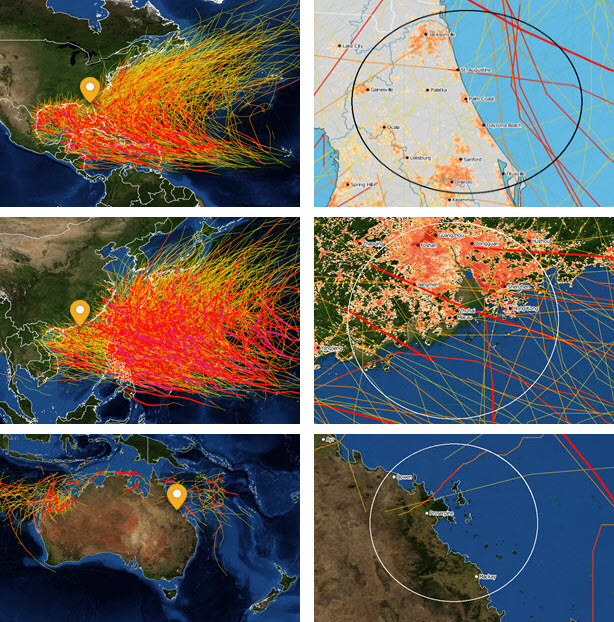
Figure 2: Three coverage regions and historical tropical cyclone track basemaps (large versions: North Atlantic, Western North Pacific and Australia). Three styles of track basemaps have been prepared and are available.
1. Historical Tracks and Wind Observations
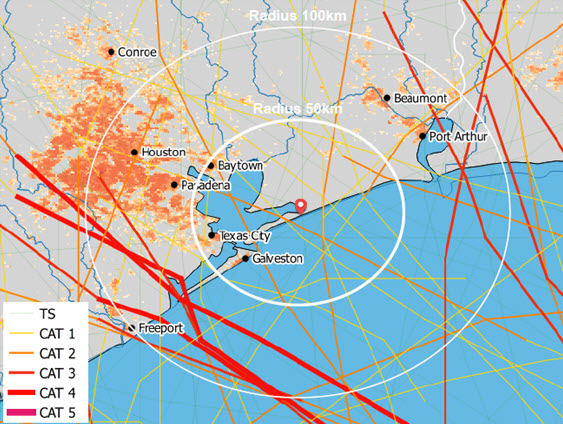
Historical track maps provide a good overview and sufficient context showing all track segments being selected under various thresholds. At the moment, our APIs allow users to enter thresholds on historical years, wind speed and a search radius that might be suggested by the known radius of maximum wind (RMW). In mapping the maximum sustained wind (MSW), we follow the commonly-used Saffir-Simpson Hurricane Wind Scale (Figure 3).
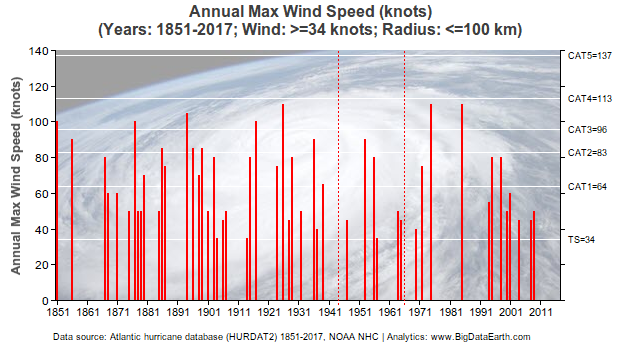
A standard report includes a list of selected historical events and a dozen charts revealing various perspectives on track positions, wind speed and central pressure (e.g. Figure 4).
Figure 3: An example map showing historical hurricane tracks
Figure 4: An example chart showing the time series of historical wind speeds
2. Wind Statistical Analysis
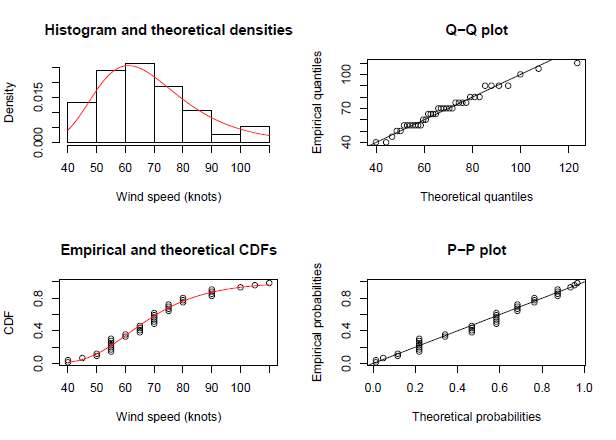
For attributes such as wind speeds and temporal occurrences, it is insightful if they are superimposed with some distribution fitting curves (e.g. Figure 5). It is exploratory in nature but does provide a convenient summary about the underlying data sampled.
In addition, we offer separate consulting services for users who are interested in an ad-hoc analysis of the full time series of historical wind records, using the generalised Pareto distribution (GPD) and the generalised extreme value (GEV) distribution. Modelled results are subject to changing sample sizes and, by so doing, the uncertainty associated with the modelling of wind extremes can be fully examined.
Figure 5: An example of exploratory wind speed distribution analysis
3. Estimating Exposure At Risk
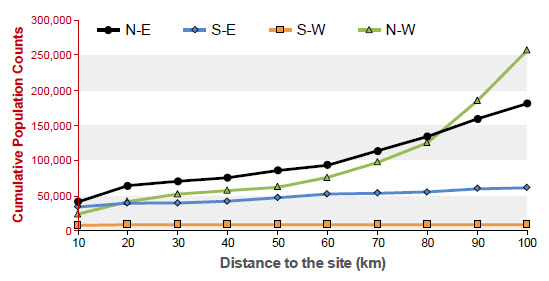
Rapid estimation of at-risk exposure (say within the radius of maximum wind) is always needed in risk analytics. We once released dedicated APIs on this and more info can be found in this blog “New Methods and Tools (Web APIs) for Innovative Exposure Analytics“. Results on exposure estimation can be reported as a standalone PDF report, or integrated into the main location profile report.
Please note that the way we present exposure estimates at four quadrants in Figure 6 is in line with the four directional (NE, NW, SW and SE) radii of maximum wind, which are typically reported in modern cyclone forecasting systems nowadays.
Figure 6: An example of exposure estimation: population counts at four quadrants.
4. Discussion and Additional Information
Widespread flooding and storm surges are often the direct consequence of landfalling tropical cyclones. For analysis of those associated hazards using similar API tools, please take a look at our flood-specific page here.
Historical observational data is the foundation of any high-level hazard modelling, and an open, objective and consistent presentation of such data will greatly help investigate the input difference or uncertainty inherent in various vendor models.
Through this major project, location profile reports on historical tropical cyclones in three regions (North Atlantic, Western North Pacific and Australia) can be automatically produced (e.g. Figure 7). Independent developers for property location and hazard risk information can integrate the accessible APIs in any third-party applications, so the information and insights revealed be readily shared with the general public and decision makers. The Developer Portal provides instructions on how to implement APIs at scale. We also provide dedicated web pages to allow users to request such reports easily. A full demonstration is available.
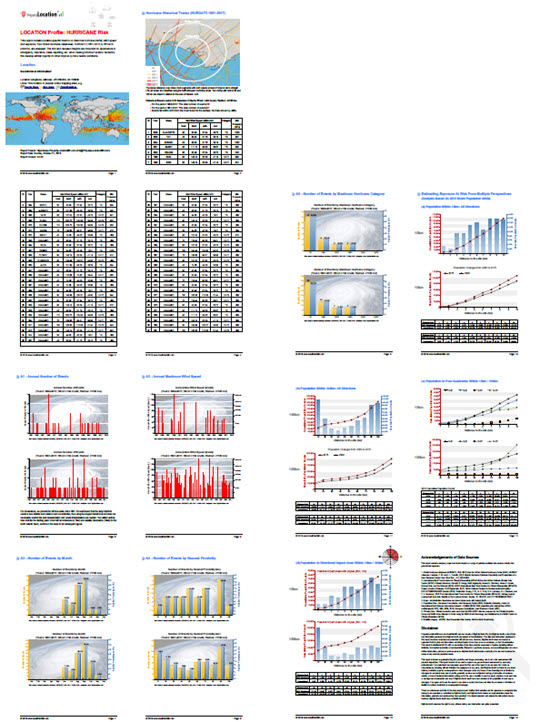
Figure 7: Sample location profile report on historical tropical cyclones
Related
– Tiled Web Maps on Historical Tropical Cyclone Tracks Available: North Atlantic | West Pacific | Australia
– The 08-09/2019 Hurricane Dorian, North Atlantic link
– The March 2019 Tropical Cyclones Veronica and Trevor, Australia link
– The February 2019 Tropical Cyclone Oma, Australia link
– The November 2018 Typhoon Yutu (Rosita), West Pacific link
– Reducing Uncertainties in Catastrophe Loss Modelling: New Advances link


