
Australian Elevation Contour Mapping (DTM / DEM)
High-resolution elevation contours built from LiDAR-derived Digital Terrain Models (DTM) and Digital Elevation Models (DEM) — sourced from Geoscience Australia’s ELVIS archive and comparable regional datasets. Delivered as contours, modelled surface water flow directions and shaded relief (hillshade) map layers, from a national 10 m baseline down to 50 cm detail across most populated areas.
Open the Interactive Contour Map
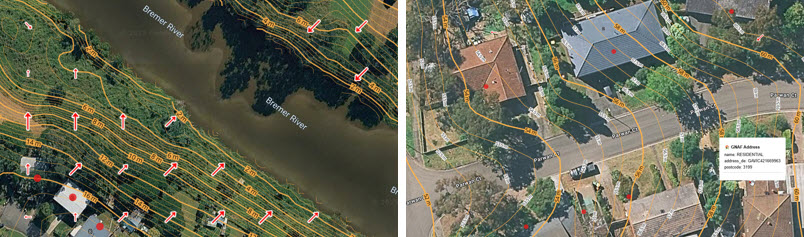
1. Elevation Contours — DTM & DEM Mapping
Contour lines generated directly from DTM/DEM elevation data, ranging from a smoothed national 10 m baseline (SRTM-derived) to LiDAR-based 2 m and 50 cm detailed contours across major Australian cities, towns and coastal regions.
-
Property and site-level assessment ahead of purchase or development
-
Land subdivision design, earthworks and cut-and-fill estimation
-
Building and development approval (DA) supporting documentation
-
Identifying low-lying, flood-prone or waterlogged land
-
Insurance underwriting, exposure review and hazard risk scoring
-
Civil, road and drainage engineering design
-
Agricultural land assessment, drainage and irrigation planning
-
Bushfire and slope-related emergency planning
-
Renewable energy siting (solar/wind) and grading feasibility studies
2. Modelled Surface Water Flow Directions
Overland flow direction and relative magnitude modelled from the underlying LiDAR DTM, showing how rainfall runoff moves across a site or catchment — independent of, and complementary to, mapped floodplains and river-based flood studies.
-
Pluvial (flash flood) and overland-flow risk assessment for a property or site
-
Stormwater network design, drainage capacity and catchment planning
-
Site feasibility studies and civil works planning
-
Flood and catastrophe risk underwriting for insurers and reinsurers
-
Local council asset management and flood mitigation prioritisation
-
Emergency response and disaster management planning
-
Identifying flow paths across new subdivisions before contours are otherwise available
-
Environmental and hydrological catchment modelling
3. Shaded Relief (Hillshade) Terrain Maps
Composite shaded relief layers rendered from high-resolution DTM/DEM data, visualising slope, ridgelines and landform shape as an intuitive terrain backdrop alongside contours, flow directions and satellite imagery.
-
Rapid visual terrain context for site inspection and due-diligence reports
-
Landslide, erosion and slope-stability risk screening
-
Bushfire behaviour and terrain-driven fire risk mapping
-
Enhancing satellite/aerial imagery and existing GIS basemaps
-
Land development and site-planning feasibility studies
-
Infrastructure, utility and transport corridor route planning
-
Geological, geomorphological and catchment analysis
-
Rural and agricultural land-use and terrain assessment
4. Detailed (5 m DTM) Coverage Areas — LGAs by State
The 5 m LiDAR-derived DTM layer underlying the detailed contour, flow-direction and hillshade maps above currently (entirely or partially) covers 240 Local Government Areas (LGAs) across Australia. Coverage is concentrated in populated and coastal regions – close to ~80% national population – and is expanding over time; broad 10 m contours remain available nationwide outside these areas. Select a state or territory below to view covered LGAs.
New South Wales (63)Ballina, Bayside (NSW), Bega Valley, Bellingen, Blacktown, Blue Mountains, Burwood, Byron, Camden, Campbelltown (NSW), Canada Bay, Canterbury-Bankstown, Central Coast (NSW), Cessnock, Clarence Valley, Coffs Harbour, Cumberland, Dungog, Eurobodalla, Fairfield, Georges River, Hawkesbury, Hornsby, Hunters Hill, Inner West, Kempsey, Kiama, Ku-ring-gai, Kyogle, Lake Macquarie, Lane Cove, Lismore, Liverpool, Maitland, Mid-Coast, Mosman, Nambucca Valley, Newcastle, North Sydney, Northern Beaches, Parramatta, Penrith, Port Macquarie-Hastings, Port Stephens, Queanbeyan-Palerang, Randwick, Richmond Valley, Ryde, Shellharbour, Shoalhaven, Strathfield, Sutherland, Sydney, The Hills, Tweed, Unincorporated NSW, Waverley, Willoughby, Wingecarribee, Wollondilly, Wollongong, Woollahra, Yass Valley |
|
Victoria (38)Banyule, Bass Coast, Bayside (Vic.), Boroondara, Brimbank, Cardinia, Casey, Darebin, East Gippsland, Frankston, Glen Eira, Golden Plains, Greater Dandenong, Greater Geelong, Hobsons Bay, Hume, Kingston (Vic.), Knox, Manningham, Maribyrnong, Melbourne, Melton, Merri-bek, Monash, Moonee Valley, Mornington Peninsula, Nillumbik, Port Phillip, Queenscliffe, South Gippsland, Stonnington, Surf Coast, Unincorporated Vic, Wellington, Whitehorse, Whittlesea, Wyndham, Yarra |
|
Queensland (35)Brisbane, Bundaberg, Burdekin, Cairns, Cassowary Coast, Charters Towers, Cook, Douglas, Fraser Coast, Gladstone, Gold Coast, Gympie, Hinchinbrook, Hope Vale, Ipswich, Isaac, Livingstone, Lockyer Valley, Logan, Mackay, Mareeba, Moreton Bay, Noosa, Palm Island, Redland, Rockhampton, Scenic Rim, Somerset, Sunshine Coast, Tablelands, Toowoomba, Townsville, Whitsunday, Wujal Wujal, Yarrabah |
|
South Australia (26)Adelaide, Adelaide Hills, Adelaide Plains, Burnside, Campbelltown (SA), Charles Sturt, Coorong, Grant, Holdfast Bay, Kingston (SA), Marion, Mitcham, Mount Gambier, Norwood Payneham and St Peters, Onkaparinga, Playford, Port Adelaide Enfield, Prospect, Robe, Salisbury, Tea Tree Gully, Unincorporated SA, Unley, Walkerville, Wattle Range, West Torrens |
|
Western Australia (45)Armadale, Bassendean, Bayswater, Belmont, Bunbury, Busselton, Cambridge, Canning, Capel, Chittering, Claremont, Cockburn, Cottesloe, Dandaragan, Dardanup, Donnybrook-Balingup, East Fremantle, Fremantle, Gingin, Gosnells, Harvey, Joondalup, Kalamunda, Kwinana, Mandurah, Melville, Moora, Mosman Park, Mundaring, Murray, Nedlands, Peppermint Grove, Perth, Rockingham, Serpentine-Jarrahdale, South Perth, Stirling, Subiaco, Swan, Toodyay, Victoria Park, Victoria Plains, Vincent, Wanneroo, Waroona |
|
Tasmania (24)Brighton, Burnie, Central Coast (Tas.), Central Highlands (Tas.), Circular Head, Clarence, Derwent Valley, Devonport, George Town, Glamorgan-Spring Bay, Glenorchy, Hobart, Huon Valley, Kentish, Kingborough, Latrobe (Tas.), Launceston, Meander Valley, Northern Midlands, Sorell, Southern Midlands, Tasman, Waratah-Wynyard, West Tamar |
|
Northern Territory (7)Belyuen, Darwin, Darwin Waterfront Precinct, Litchfield, Palmerston, Unincorporated NT, Wagait |
|
Australian Capital Territory (1)Unincorporated ACT |
Elevation contours, surface water flow directions and shaded relief are derived products built from open DTM/DEM elevation data — principally Geoscience Australia’s ELVIS Elevation Information System — and comparable LiDAR archives, used under CC BY 4.0. These layers are derived products and are not endorsed by, or the responsibility of, the source agencies. Explore all layers together, including detailed 50 cm contours and flash-flood prone areas, on the interactive Contour Mapping & Hydro-Terrain Intelligence platform.