High-resolution Vegetation Mapping for 48 Contiguous U.S. States
Initial release: June 2016
We have sourced the comprehensive, orthorectified digital aerial imagery from the USDA National Agriculture Imagery Program (NAIP) and performed advanced imagery feature extraction.
The most recent NAIP imagery acquired in 2015, 2014 and 2013 growing seasons (at 1m-resolution and for 48 contiguous U.S. States) has been analyzed. The total file size of the input imagery is ~180 terabytes in an uncompressed form. To our knowledge, this is the first time that large-scale vegetation mapping is done at such a detailed level. This project demonstrates excellent application opportunities using modern Earth Observation and geospatial big data analytics.
Overview of 1m-resolution 2015/2014/2013 NAIP input imagery
(for 48 contiguous U.S. States)
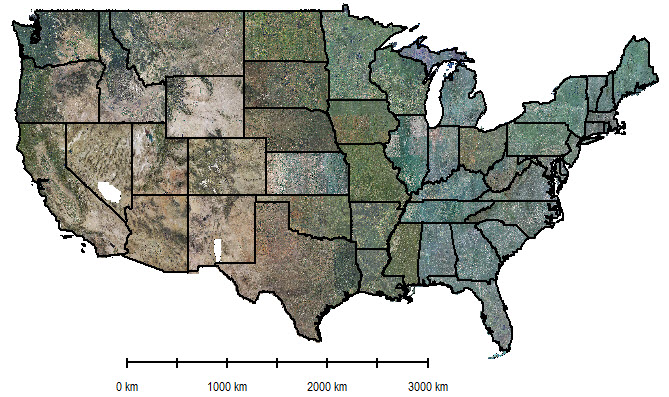
Image Processing and Feature Extraction
A number of key features of the NAIP aerial imagery are important for the classification of vegetation: (1) consistent 1m high resolution; (2) new acquisitions in 2015, 2014, and 2013; (3) including R/G/B/NIR bands; (4) virtually zero or minimized cloud covers; and (5) vibrant colors as the ortho imagery was captured during the agricultural growing season or “leaf on” conditions.
By comparison, it is hard to find high-resolution satellite imagery sources, including those from DigitalGlobe, Airbus Defence and Space, Google Terra Bella, Planet Labs, and Urthecast, that can offer all of these advantages in a single source, especially for a very large territory.
We have widely explored and tested pixel- and object-based image classification techniques, vegetation indices, and newly developed machine learning and classification methods for this feature extraction task. Also leveraging affordable data storage (more than a petabyte – 1,000 terabytes – in terms of the size of all temporary files during image processing) and high-performance computing, we have achieved a very high accuracy of vegetation classification so that an objective, visual assessment becomes possible. We present a few examples below for illustration.
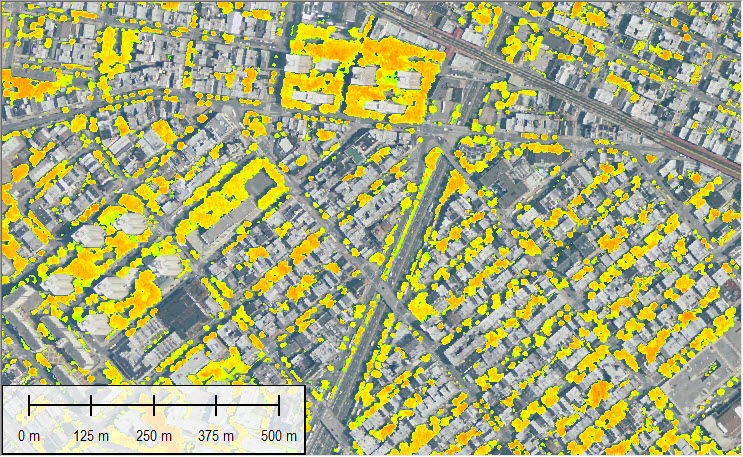
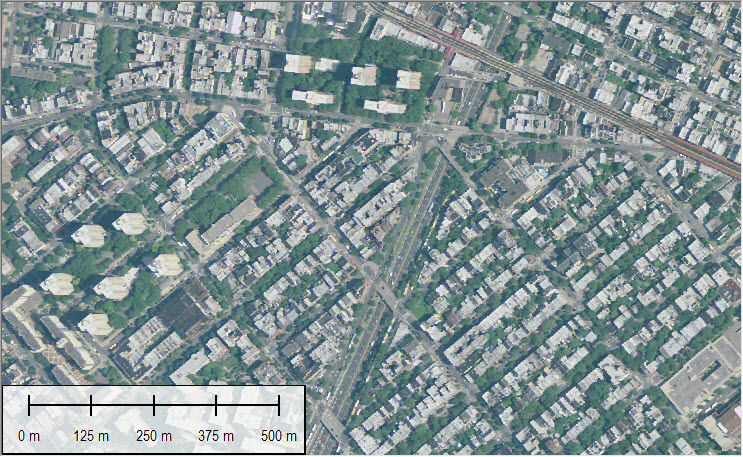
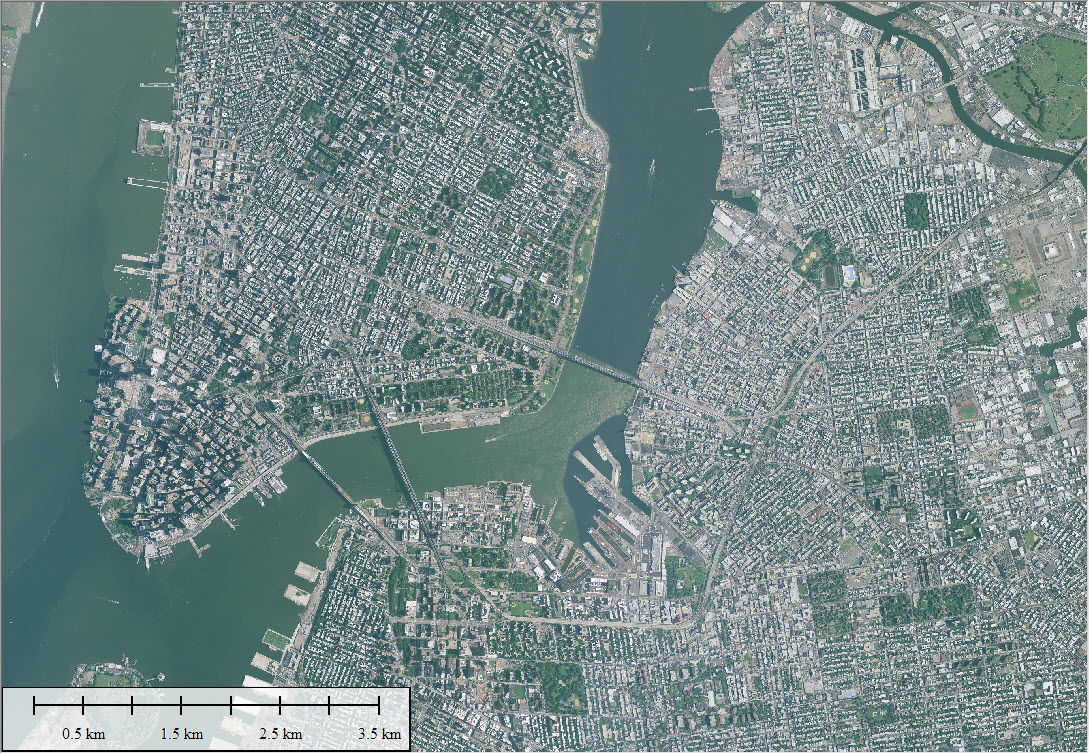
Location: New York. Left: Extracted vegetation; Right: Input imagery for reference
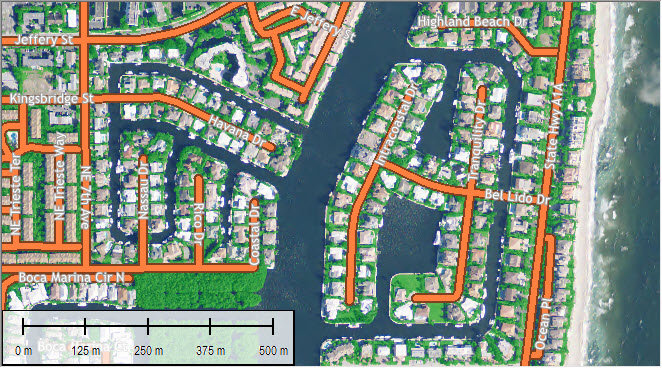
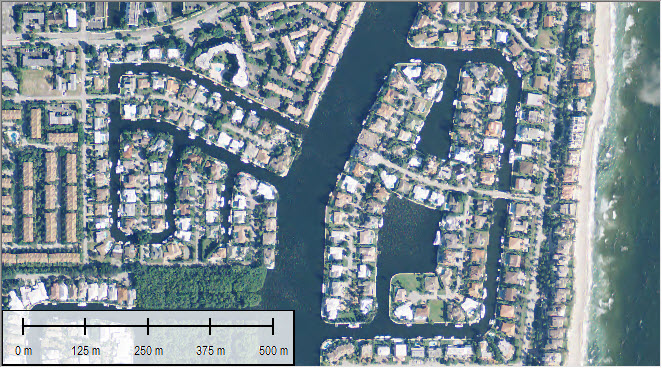
Location: Florida. Left: Extracted vegetation; Right: Input imagery for reference
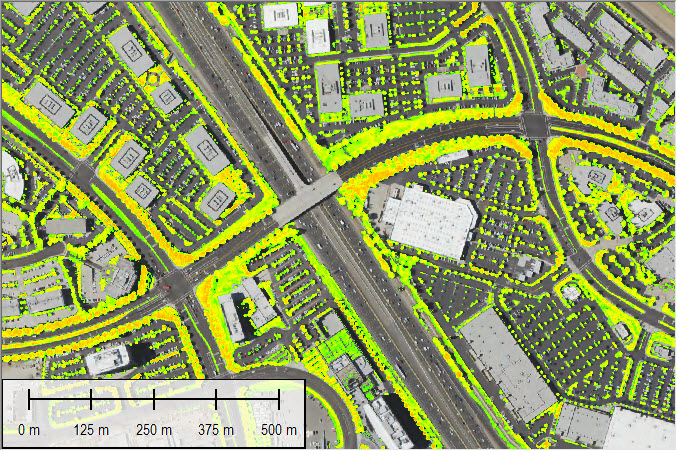
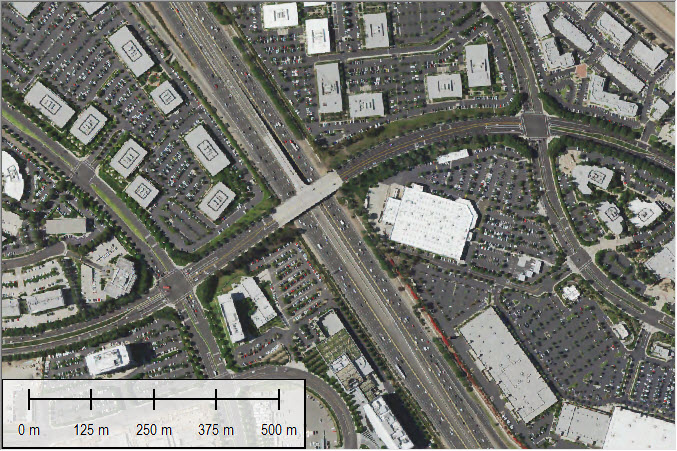
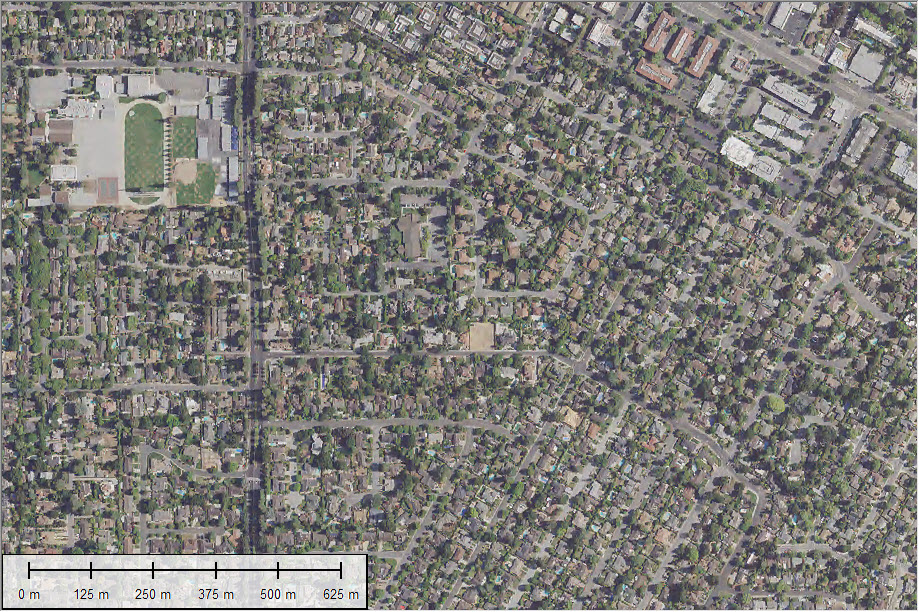
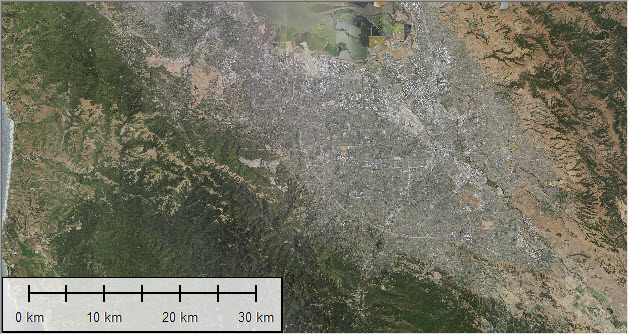
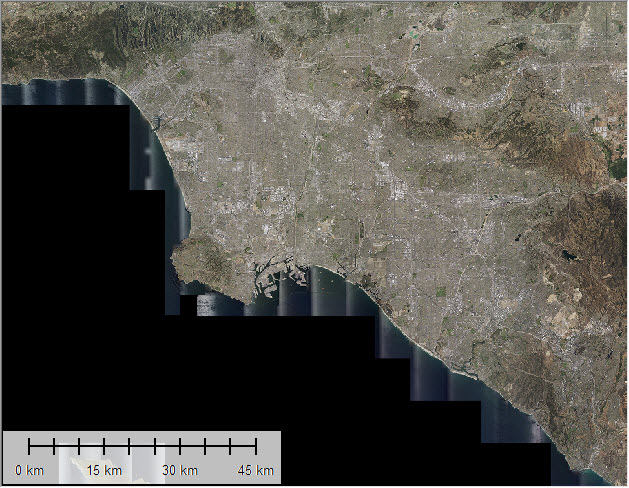
Location: Los Angeles. Left: Extracted vegetation; Right: Input imagery for reference
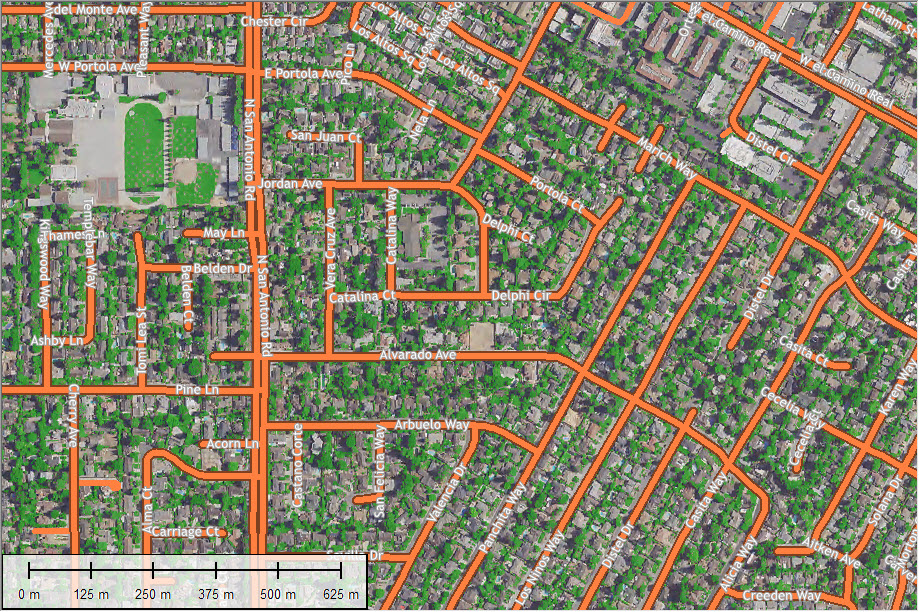
Location: San Francisco. Left: Extracted vegetation; Right: Input imagery for reference
Applications: Estimating the % of Vegetation by ZIP Code, census Block Group, and other Spatial Units
Given the very high accuracy of the vegetation classification, we are now able to more objectively estimate the percentage (%, or the density) of vegetation across various geographical areas.
The following geographical boundaries extracted from the 2015 TIGER/Line Shapefiles are used to estimate the % of vegetation:
-
5-Digit ZIP Code (about 38,000 areas for 48 states)
-
Census Block Group (about 210,000 areas for 48 states)
-
Census Tract (About 72,000 areas for 48 states)
-
Place
-
County
(Note that any other geographical areas can be adopted for similar estimation as well.)
Once this is consistently done for each of the 48 states, many other analyses can be further explored, e.g.
-
Ranking ZIP Codes with the highest or lowest % of vegetation for a city or a customized region.
-
How does this effectively complement other physical environmental, and socioeconomic attributes from census?
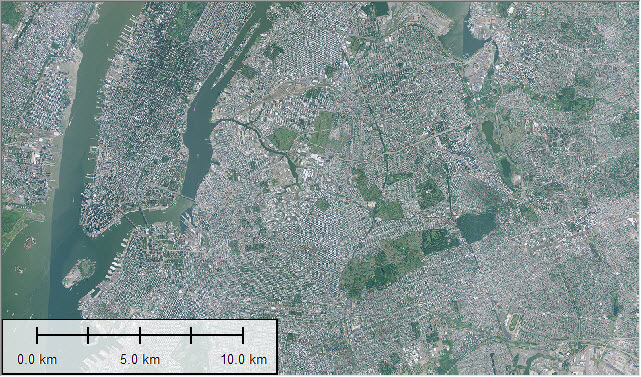
Location: New York. Left: % of vegetation estimated at ZIP Code level; Right: Underlying imagery for reference.
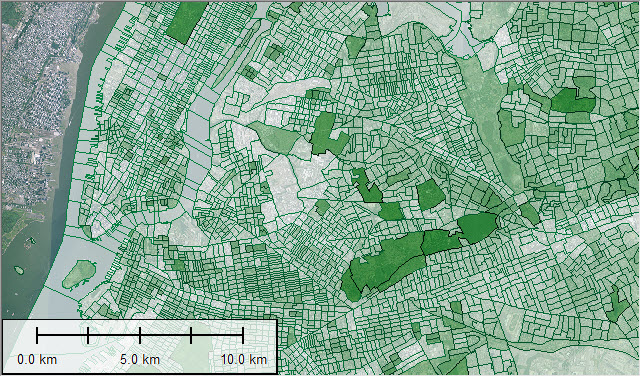
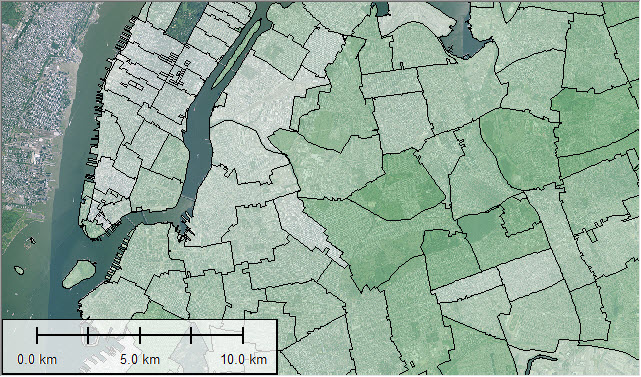
Location: New York. Left: % of vegetation estimated at census Block Group level; Right: Underlying imagery for reference.
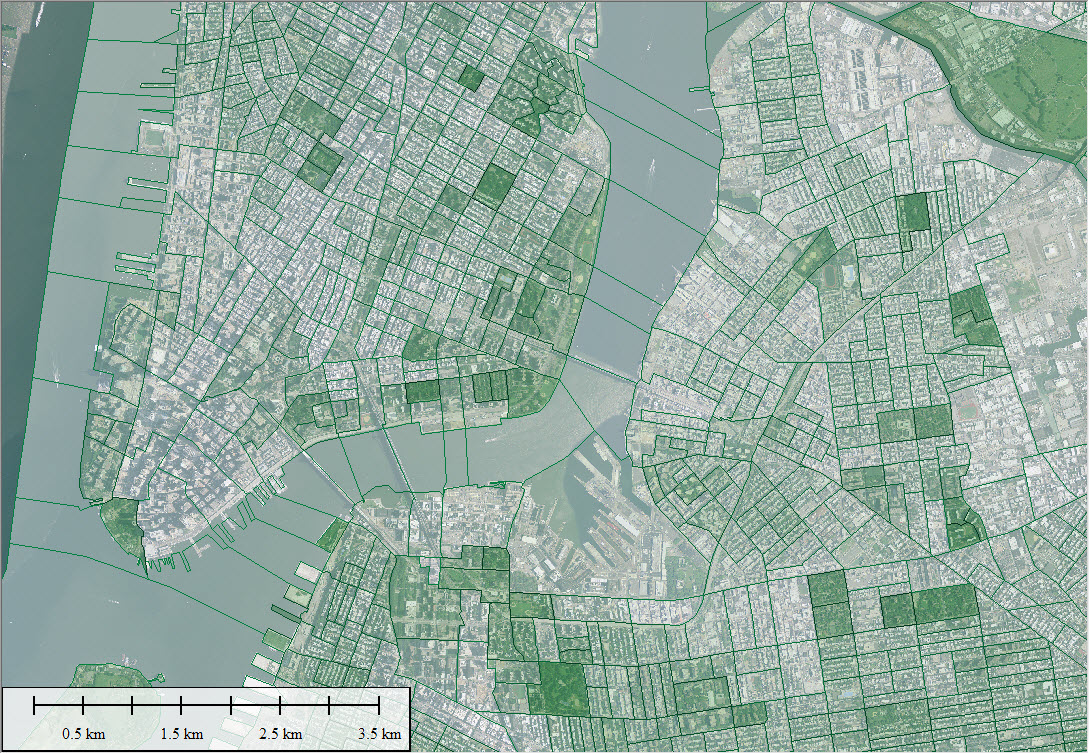
Location: New York. Left: % of vegetation estimated at census Block Group level (zoomed view); Right: Underlying imagery for reference.
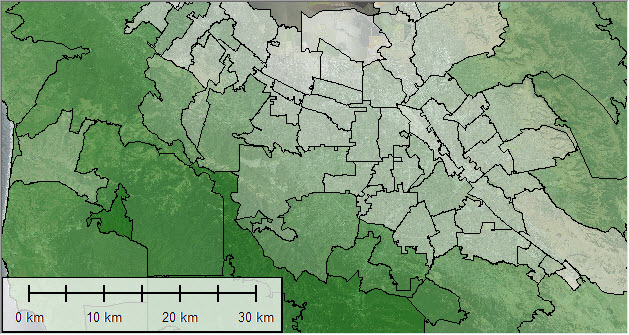
Location: San Francisco. Left: % of vegetation estimated at ZIP Code level; Right: Underlying imagery for reference.
Location: San Francisco. Left: % of vegetation estimated at census Block Group level; Right: Underlying imagery for reference.
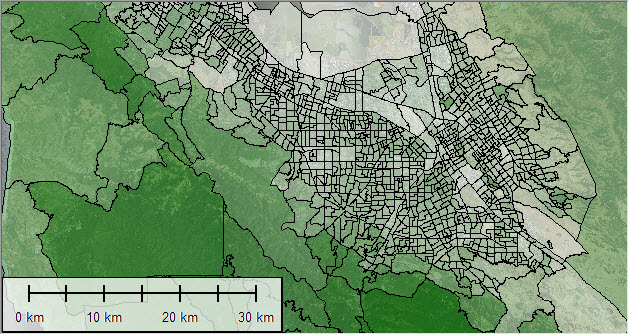
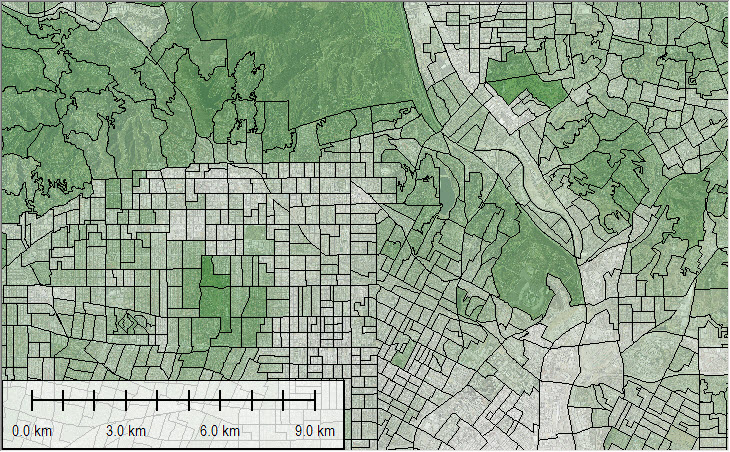
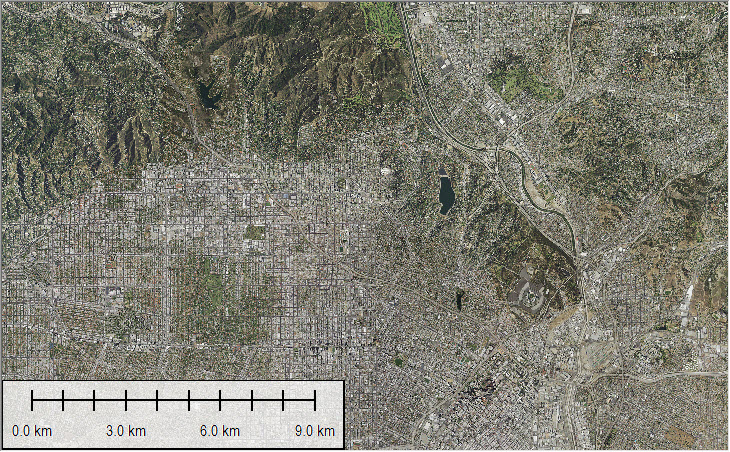
Location: Los Angeles. Left: % of vegetation estimated at ZIP Code level; Right: Underlying imagery for reference.
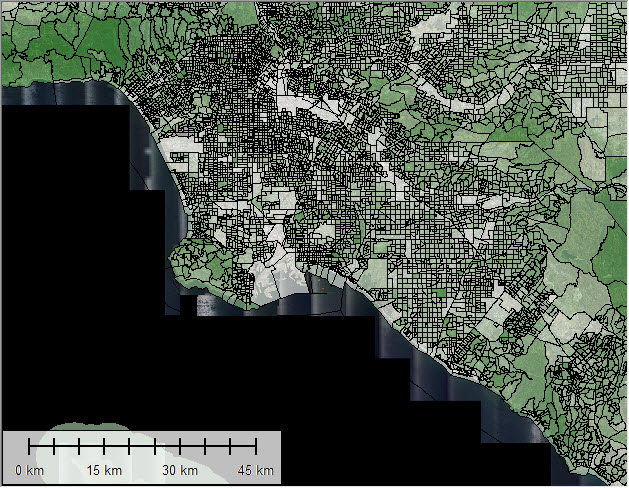
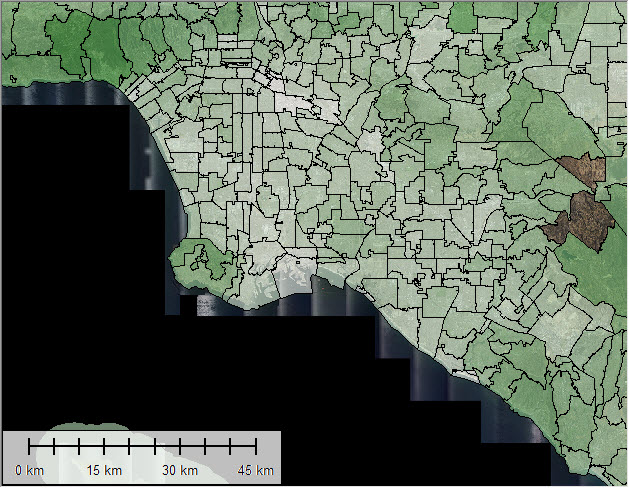
Location: Los Angeles. Left: % of vegetation estimated at census Block Group level; Right: Underlying imagery for reference.
Location: Los Angeles. Left: % of vegetation estimated at census Block Group level; Right: Underlying imagery for reference.
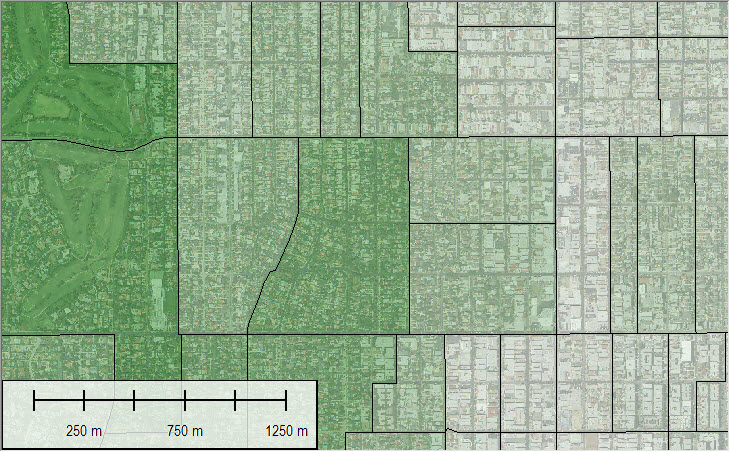
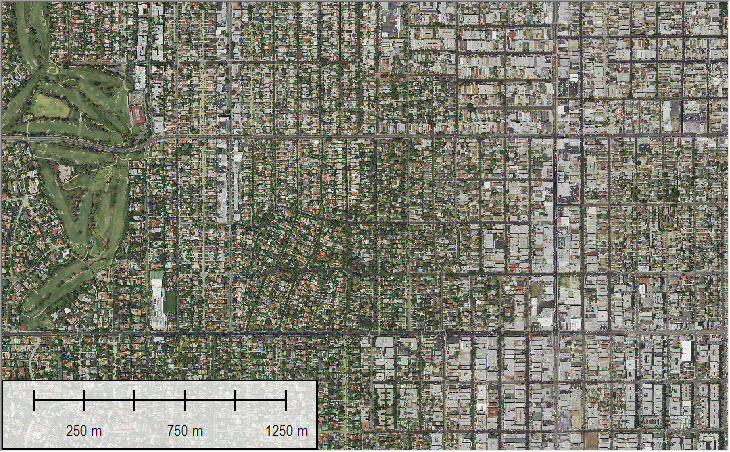
Location: Los Angeles. Left: % of vegetation estimated at census Block Group level; Right: Underlying imagery for reference.
Large-sized, Unique Data Products Available
-
Measured % of vegetation by ZIP Code, census Block Group, or any other geographical area
-
Address-level vegetation estimation (for addresses in California): Web APIs
-
State-level imagery mosaics / basemaps (1m-resolution natural-color RGB composite and false-color CIR composite, ~9.0 terabytes in compressed JPEG2000 format). Raster data are produced at various spatial resolutions (e.g. 1m, 2m, 5m, or 10m).
-
License available for 48 states as a whole, or by individual states.
-
License options: Company-wide, Integrator, or Exclusive re-distribution.