Initial release: 31 March 2017
The south-east QLD and northern NSW are often afflicted with widespread flooding caused by the torrential rain typically associated with ex-cyclones, and this time with the remnants of severe Tropical Cyclone Debbie which made landfall on the QLD coast between Bowen and Mackay on 28 March 2017. Based on the Australian Government Bureau of Meteorology (BoM), the Tweed River valley in northern NSW received 500 – 740mm of rain in the 24 hours to 2:00am today. BoM has issued many flood warnings for the larger region, including the two warnings specific to the major flooding in Lismore and Murwillumbah:
- Major Flood Warning for the Wilsons River and minor to major flood warning for the Richmond River (Flood Warning Number: 11 – Issued at 9:02 pm EDT on Friday 31 March 2017): Major flooding is occurring along the Wilsons River at Lismore where the river peaked near 11.60 metres around midday Friday, the highest flood peak since the 1974 event.
- Moderate to Major Flood Warning for the Tweed River (Flood Warning Number: 17 – Issued at 5:45 pm EDT on Friday 31 March 2017): The Tweed River at Murwillumbah peaked at an estimated 6.20 metres around 04:30 am Friday with major flooding, and is falling slowly.
Extensive inundation and sheer devastation has been observed and reported.

(NSW flooding: Lismore ordered to evacuate, Murwillumbah residents stuck on roofs – ABC News)
For flood mapping, a main approach is to use high-accuracy Digital Terrain Model (DTM) to model and delineate potential flood-prone areas. After acquiring the 5m-resolution, LiDAR-derived DTM from Geoscience Australia’s ELVIS Elevation Information System for the above two areas, we have quickly made two animations to estimate the changing extent of inundation in the relatively flat floodplains as water level rises.

Figure 1: The Wilsons River at Lismore peaked near 11.60 metres around midday Friday. Click the picture above to see the full animation.

Figure 2: The Tweed River at Murwillumbah peaked near 6.20 metres around 04:30 am Friday. Click the picture above to see the full animation.
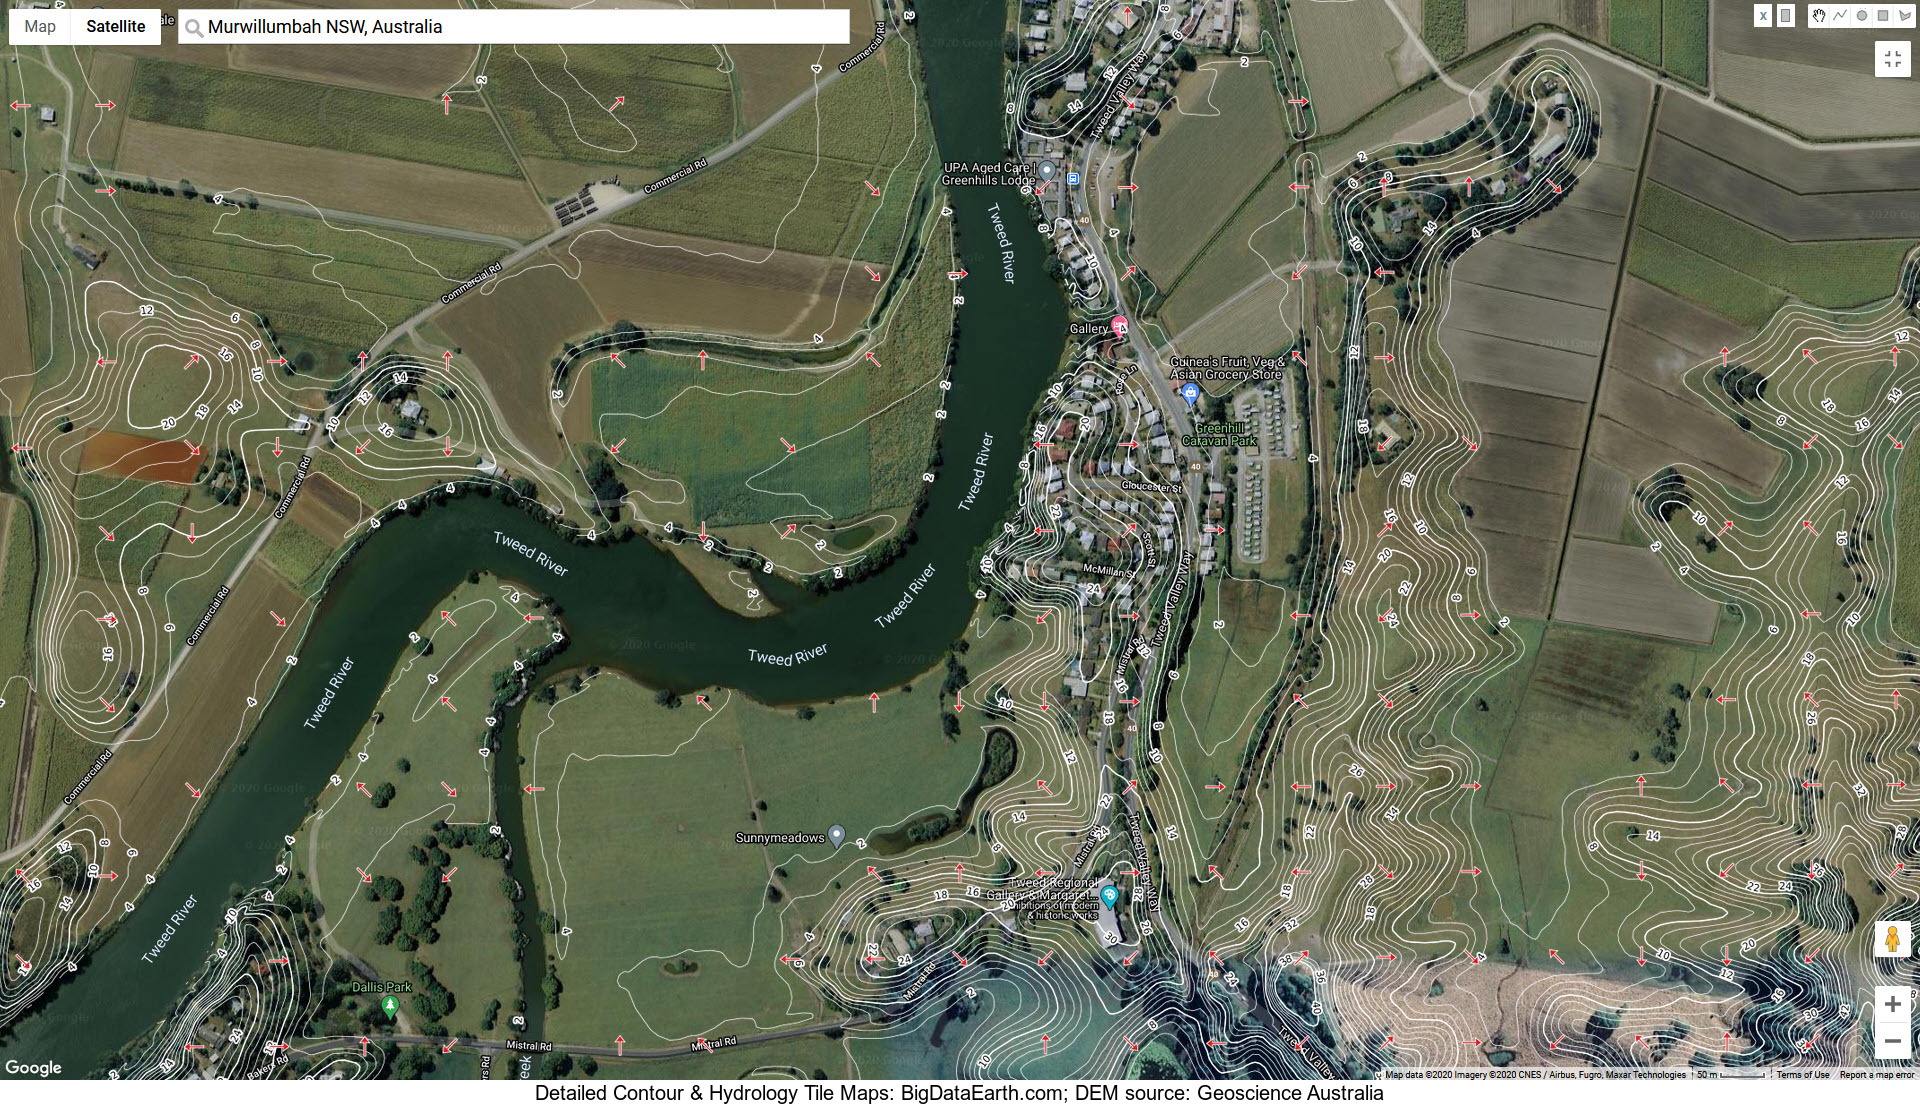
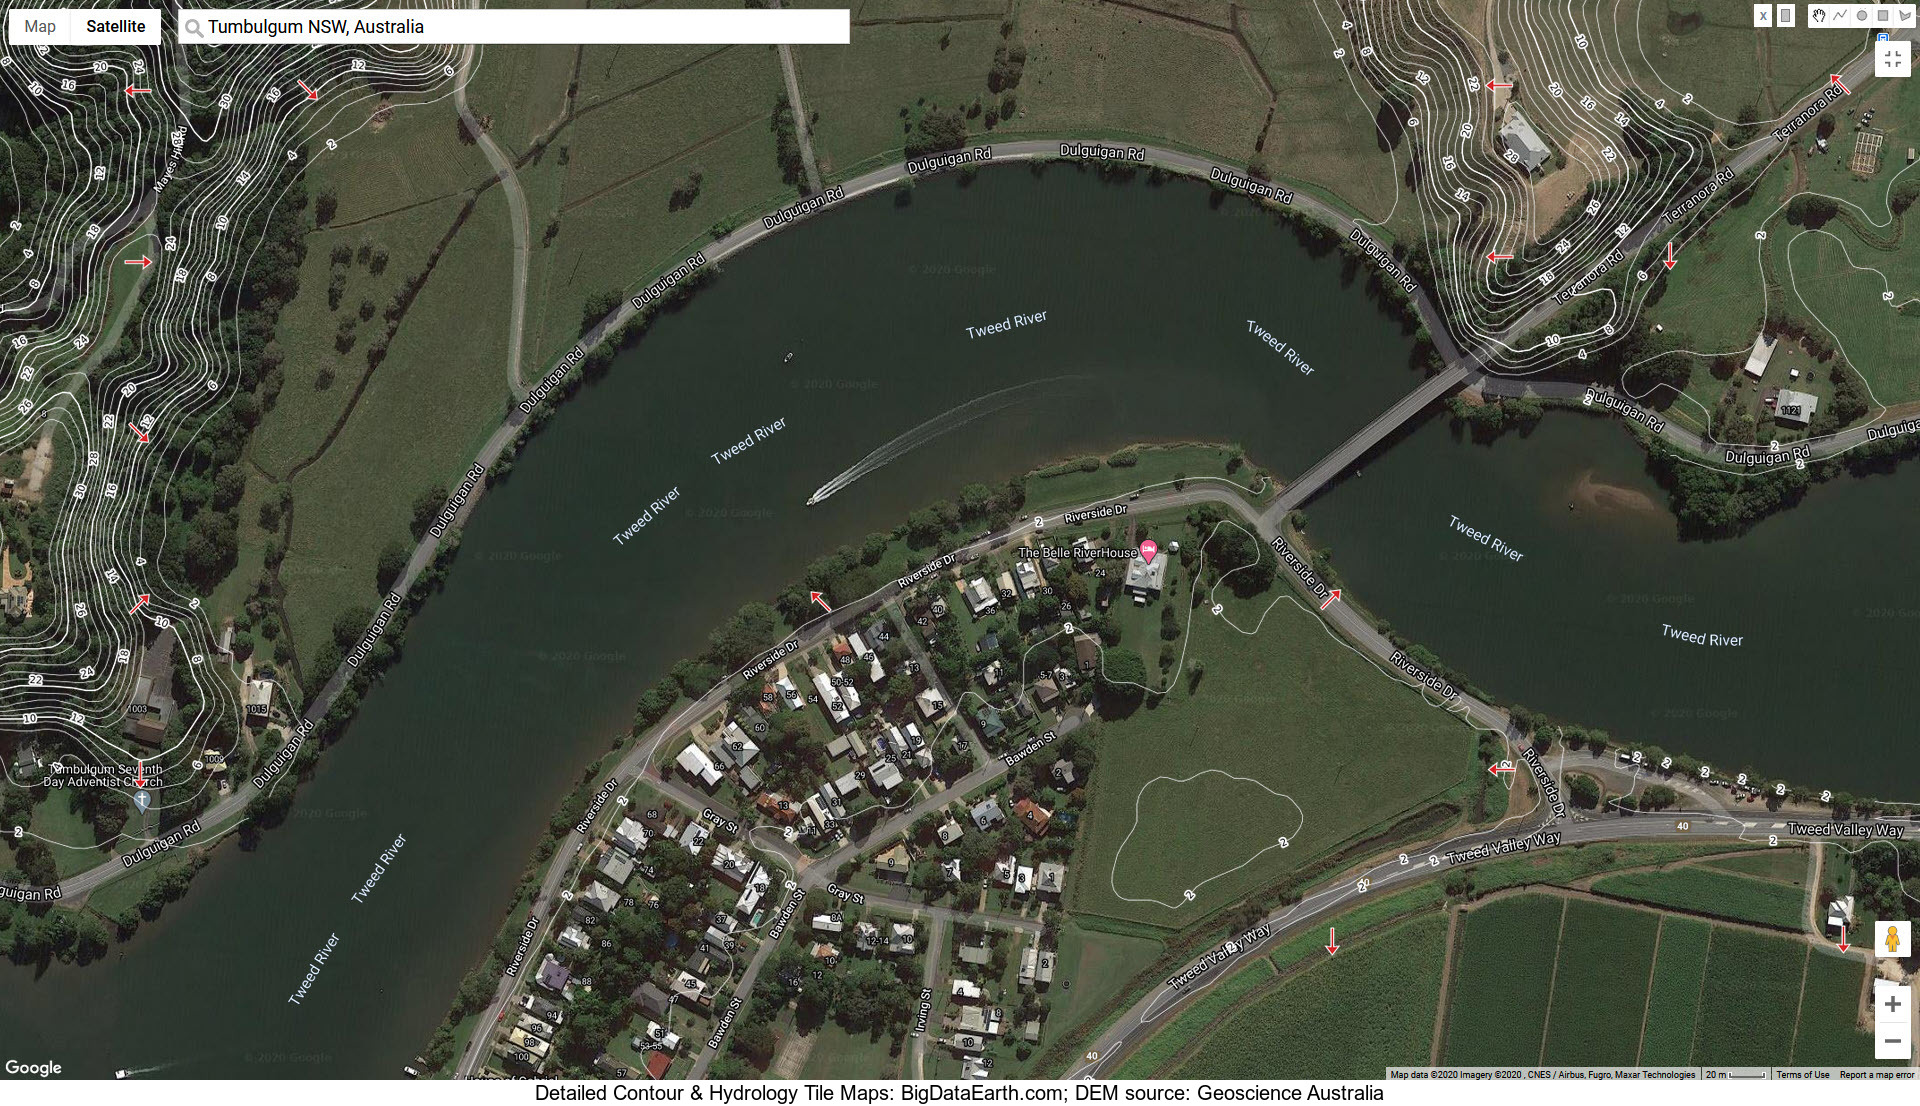
Figure 3: Scalable tile map showing detailed contours and modelled surface water flow directions;
Location: Tweed River at Murwillumbah